r/Infographics • u/Time_Chemist_8566 • 3h ago
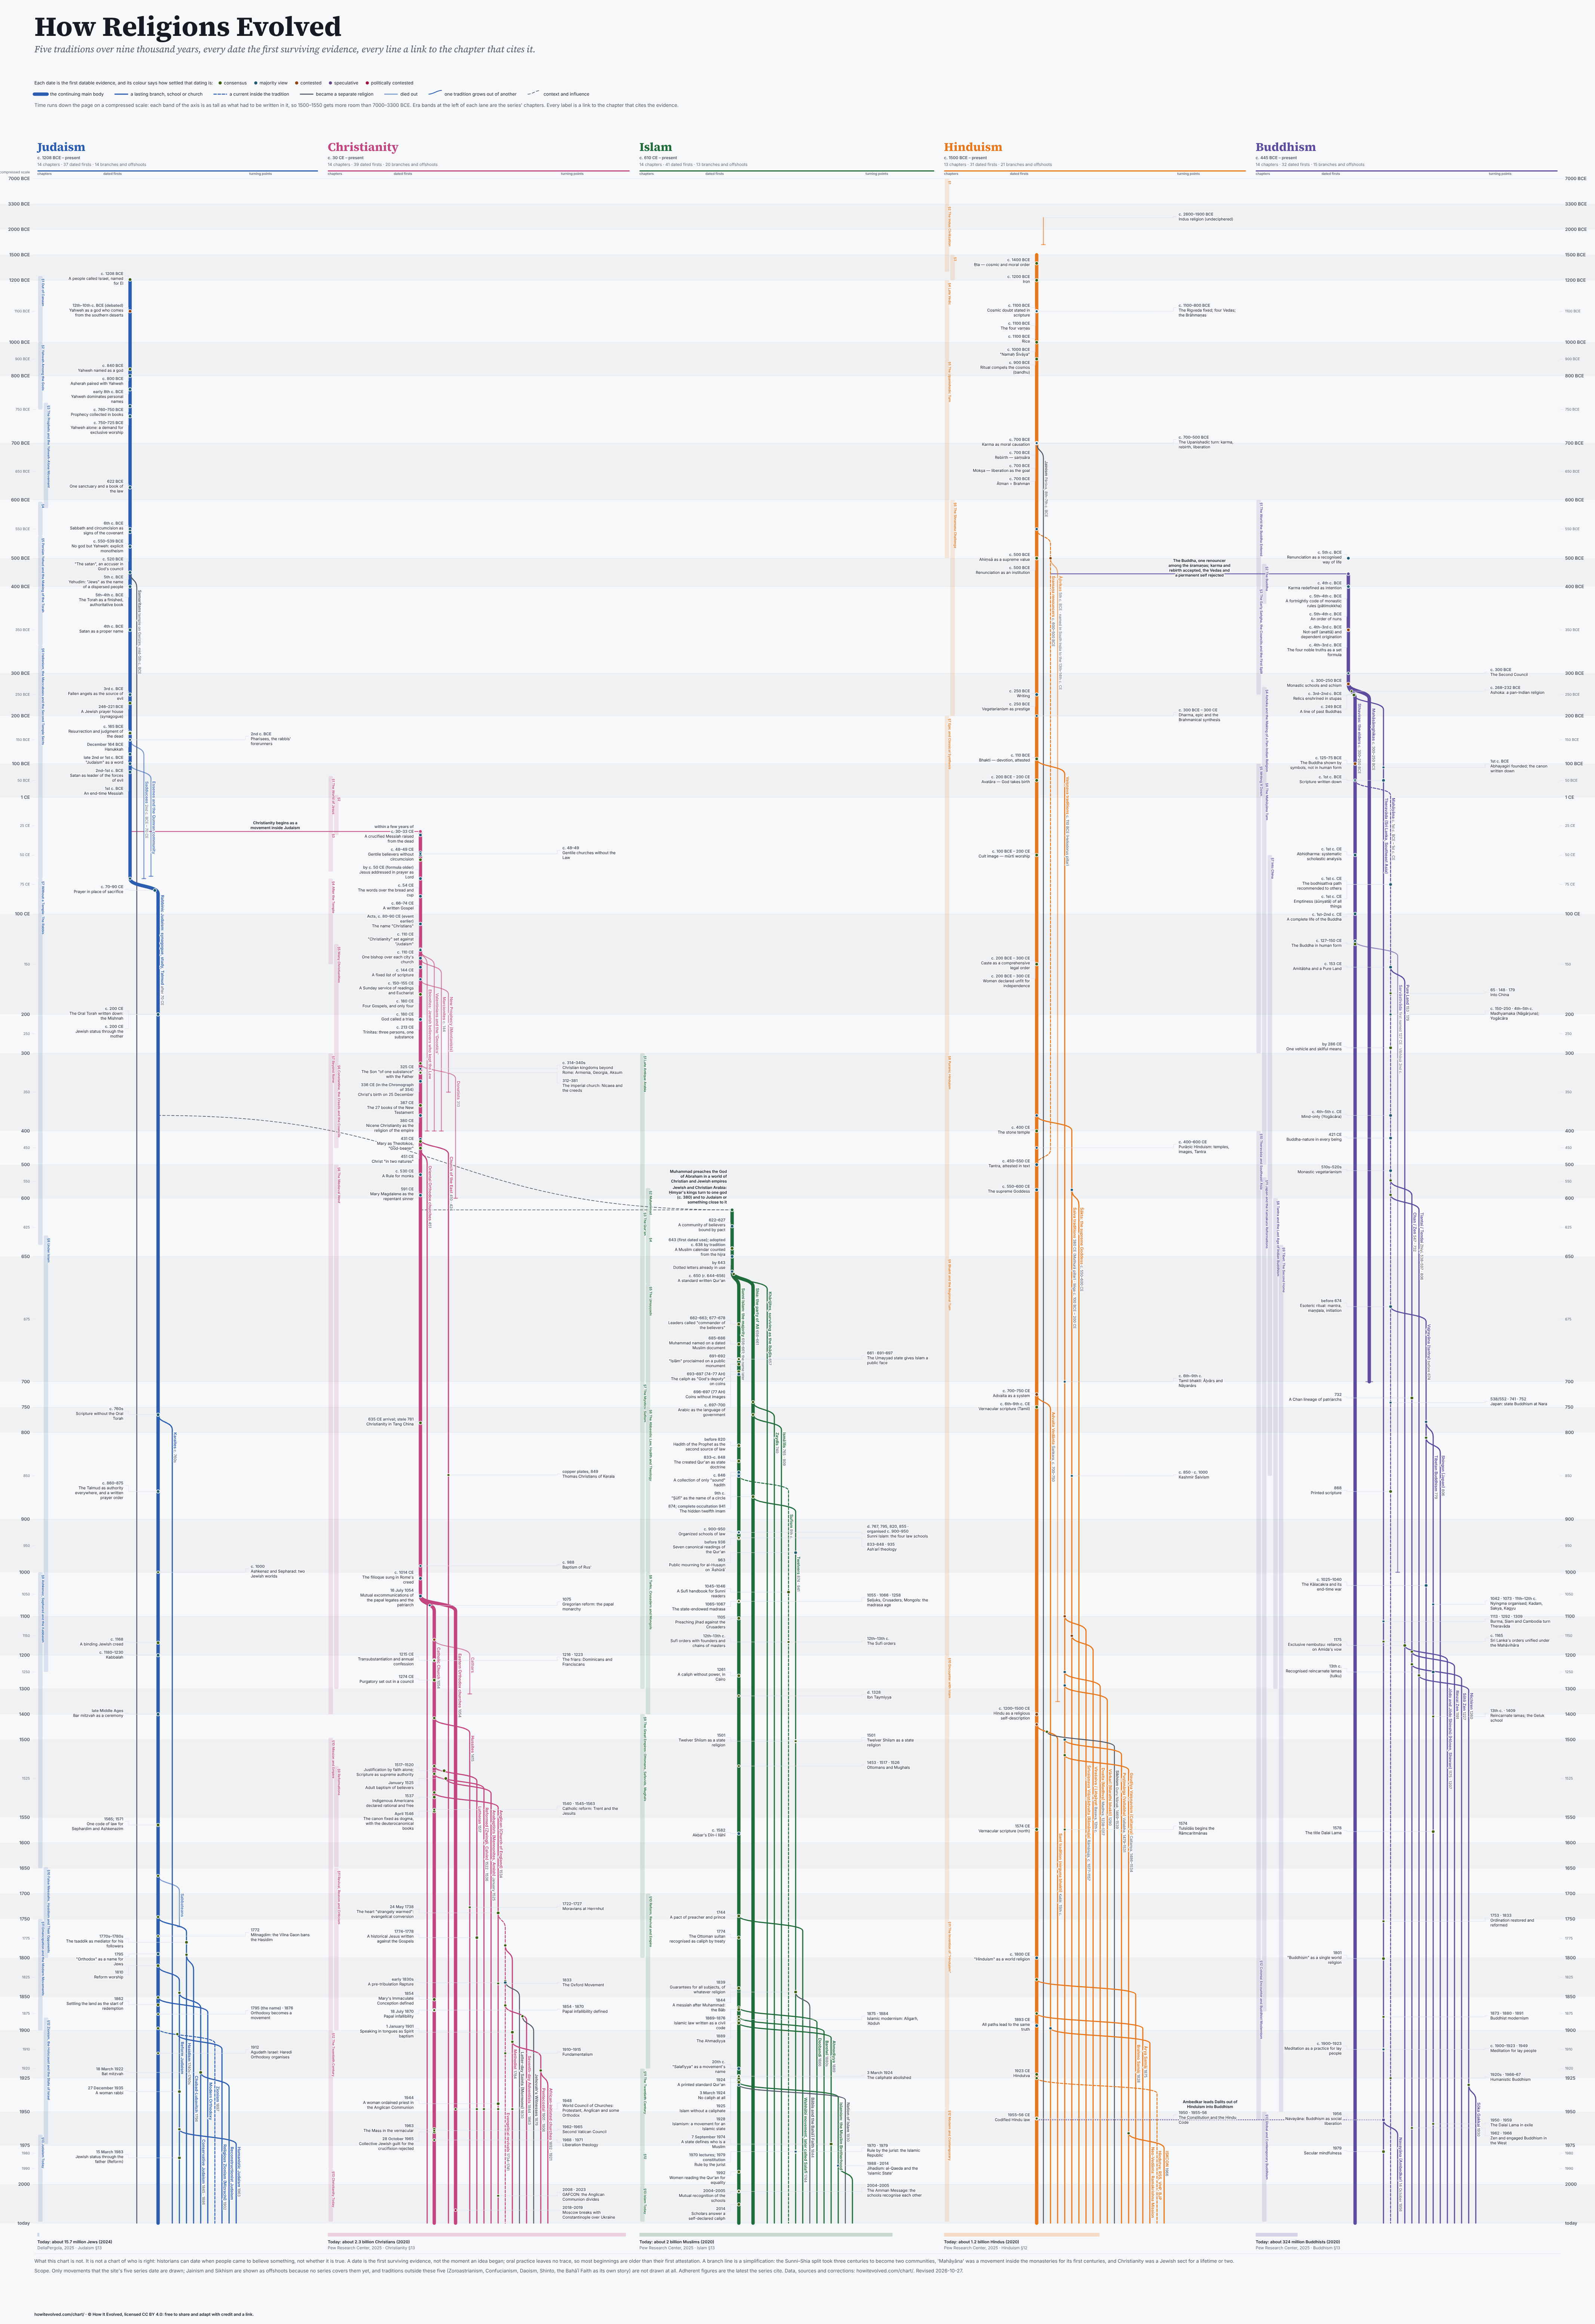
How religions evolved?
76
Upvotes
r/Infographics • u/123VoR • Jun 01 '20
r/Infographics • u/CurlyCathie • 18h ago
r/Infographics • u/bezdazen • 11h ago
There is quite a bit of controversy surrounding r/opensource's new anti-AI rule. A lot of responses on reddit pointed out that this rules out Linux. I figured its likely not just Linux, so I checked which of the biggest open-source projects allow AI-assisted contributions.
I took the 50 most-starred GitHub projects that meet the rule's other requirements (OSI license, at least a year old, maintained, 3+ contributors; no lists, books or courses) and read each one's AI policy, contributing guide, PR template, instructions for AI agents and merged commits.
The cards quote each project's own files, and every quote was checked word for word against the file. A moderator later said Linux isn't banned because its AI use isn't "obvious", so this shows what the projects say, not what the subreddit will remove.
Interactive version of 1st graphic: https://rhp.vercel.app/gallery/real-posters/ai-allowed-chart/
Interactive version of 2nd graphic: https://rhp.vercel.app/gallery/real-posters/ai-allowed-infographic/
r/Infographics • u/InfiniteFudge1973 • 12h ago
r/Infographics • u/NBrief • 6h ago
Political and issue ads. Meta: Jul. 20-Oct. 17, 2026; Google: Jan. 1-Oct. 17, 2026, covering 63% of Google spending.
Source: ScrapeLads analysis of Meta and Google ad reports.
r/Infographics • u/NBrief • 19h ago
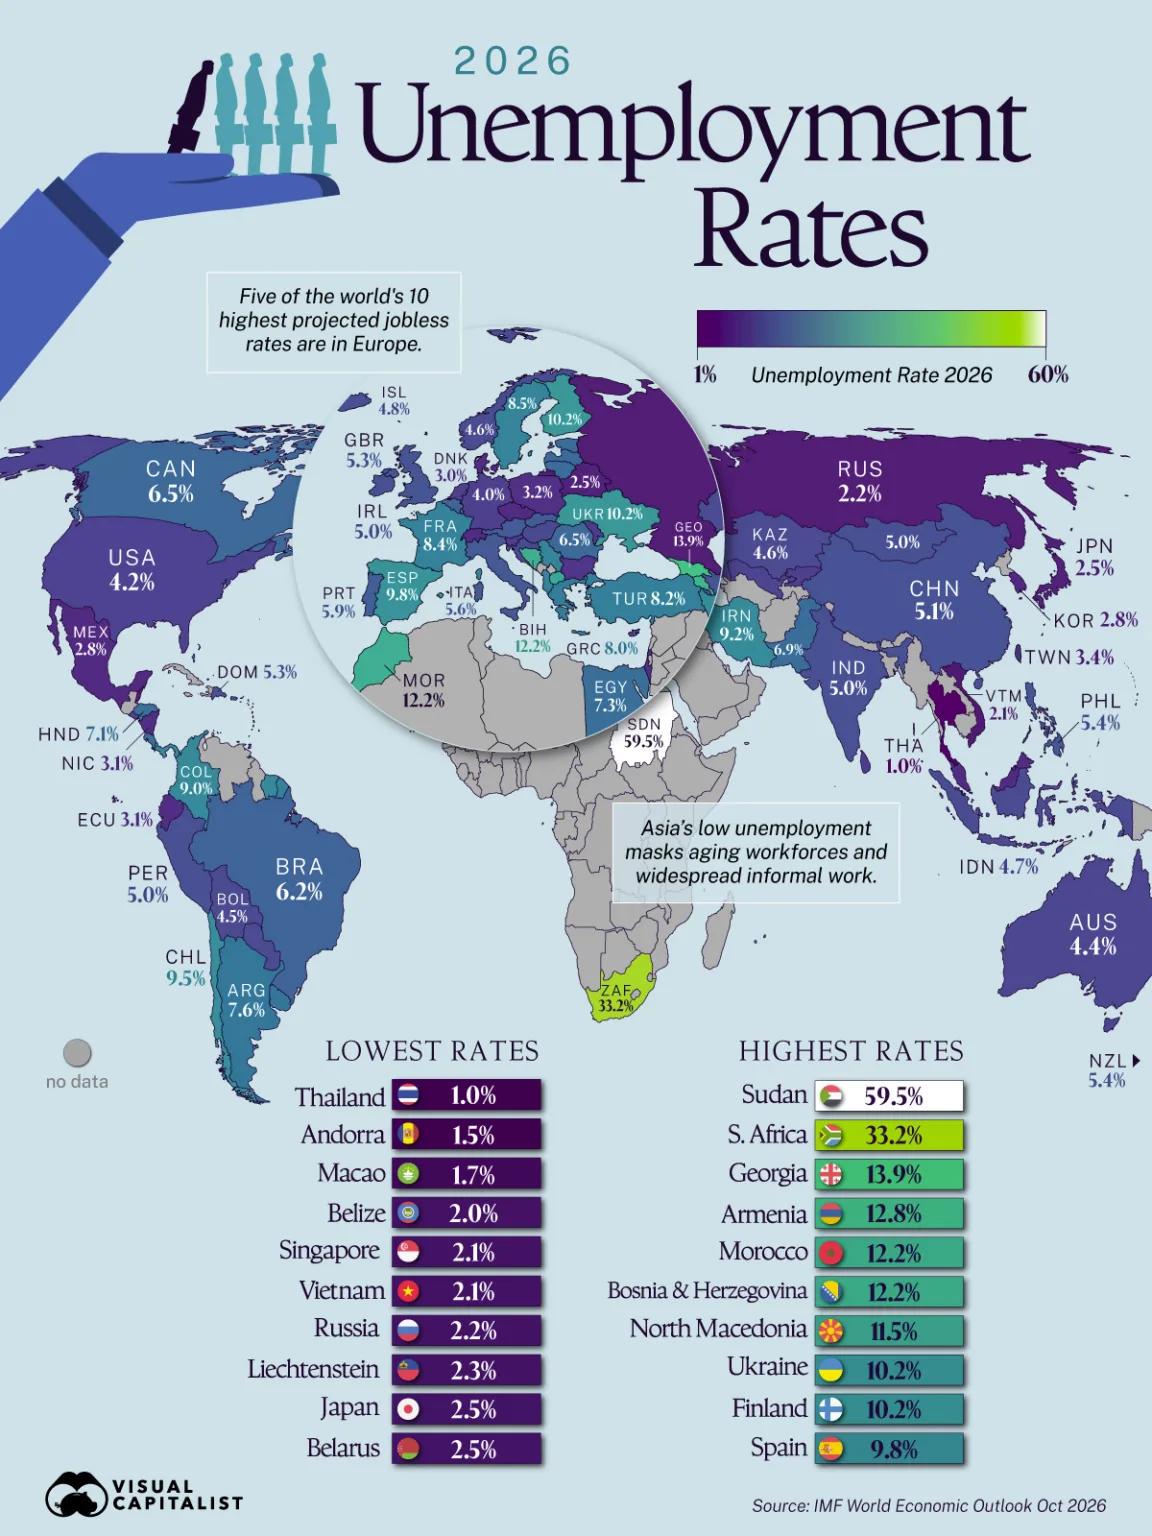
Source: IMF World Economic Outlook Oct 2026
r/Infographics • u/milionsdeadlandlords • 13h ago
r/Infographics • u/joshtaco • 20m ago
r/Infographics • u/Turbulent-Shift167 • 2h ago
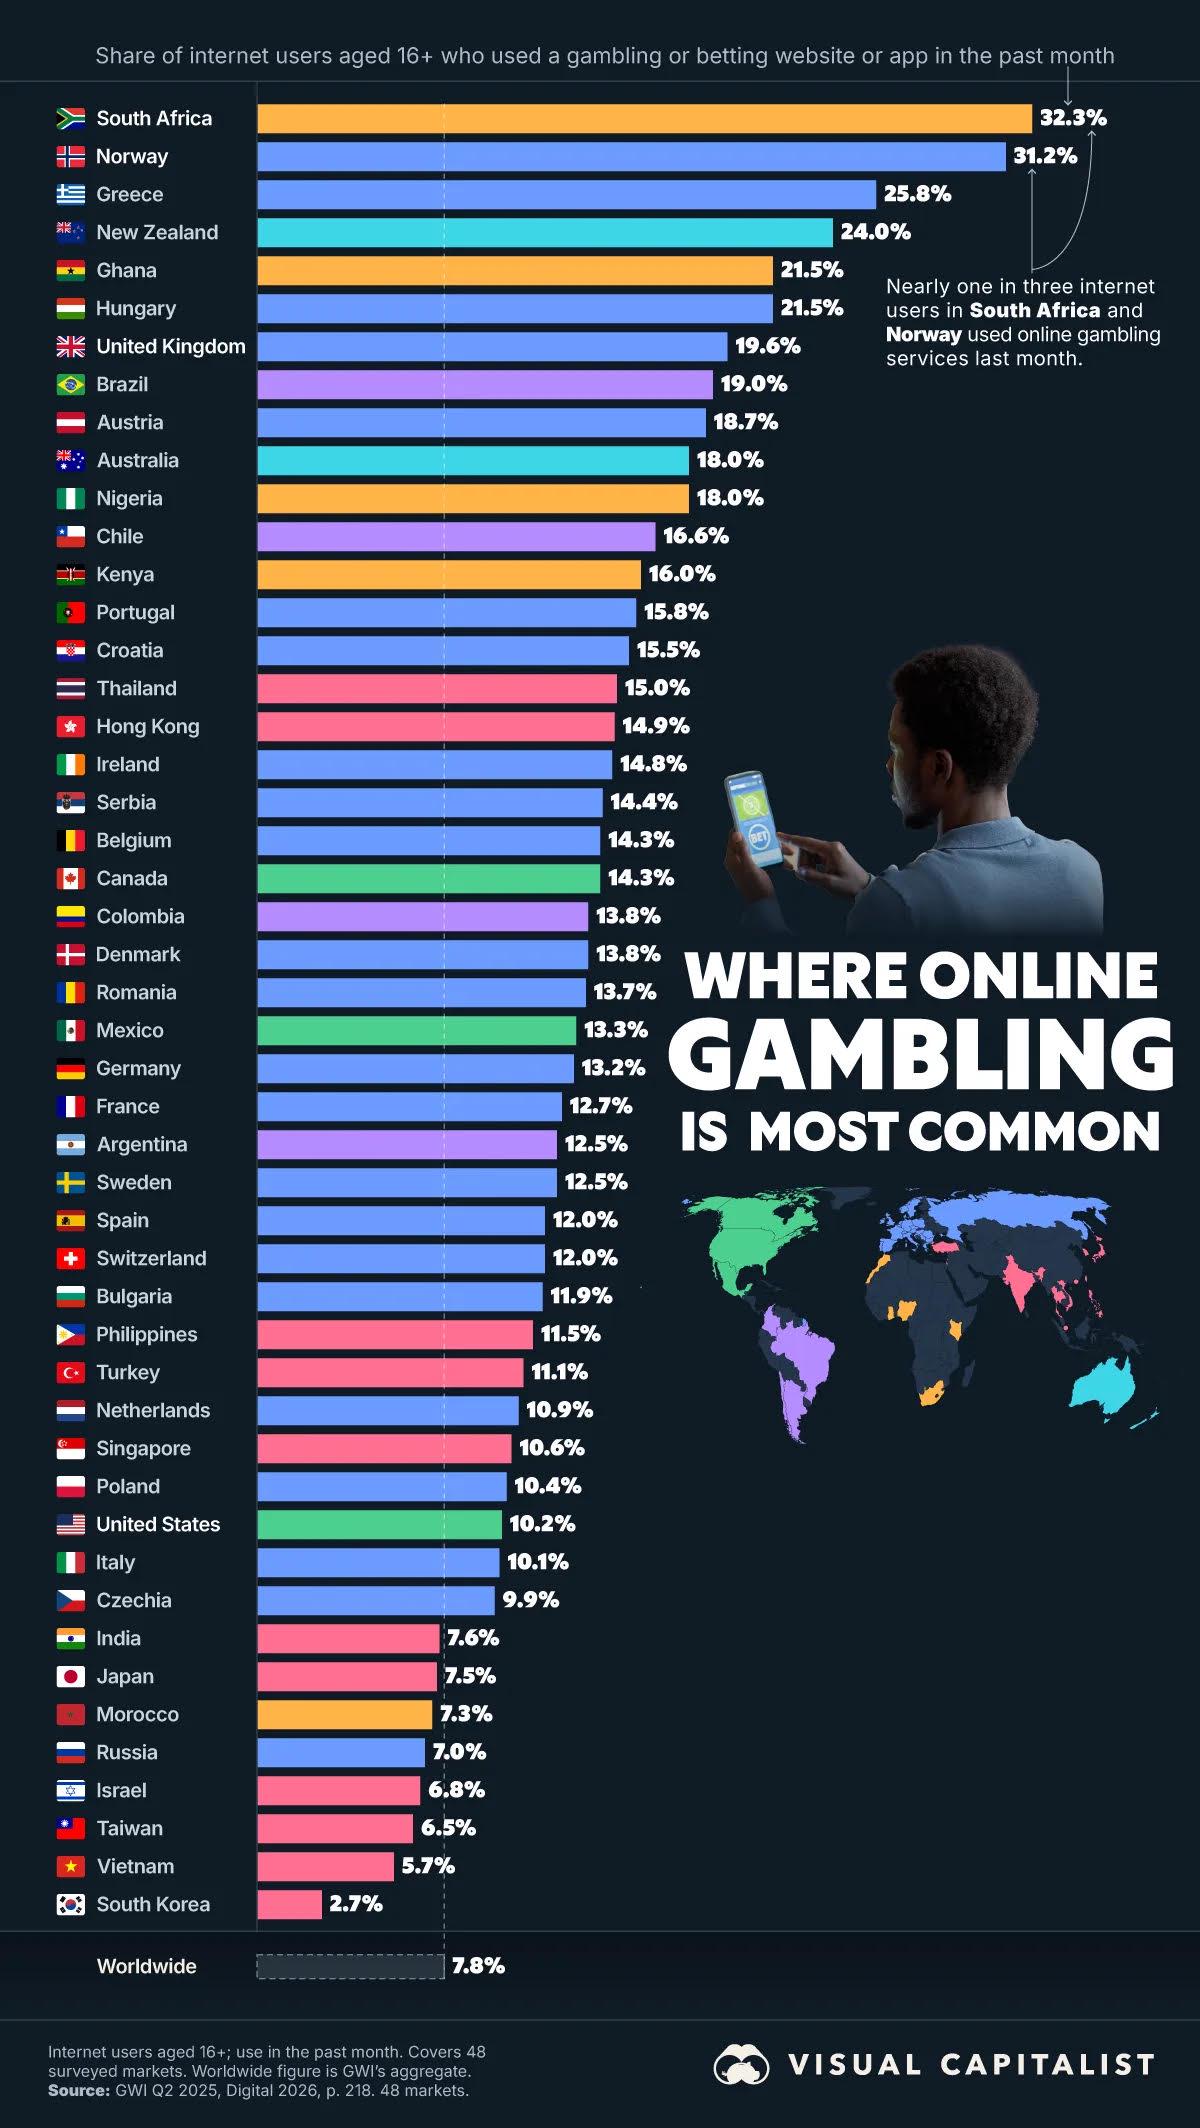
Less than 8% of global internet users use online gambling services.
r/Infographics • u/RobinWheeliams • 17h ago
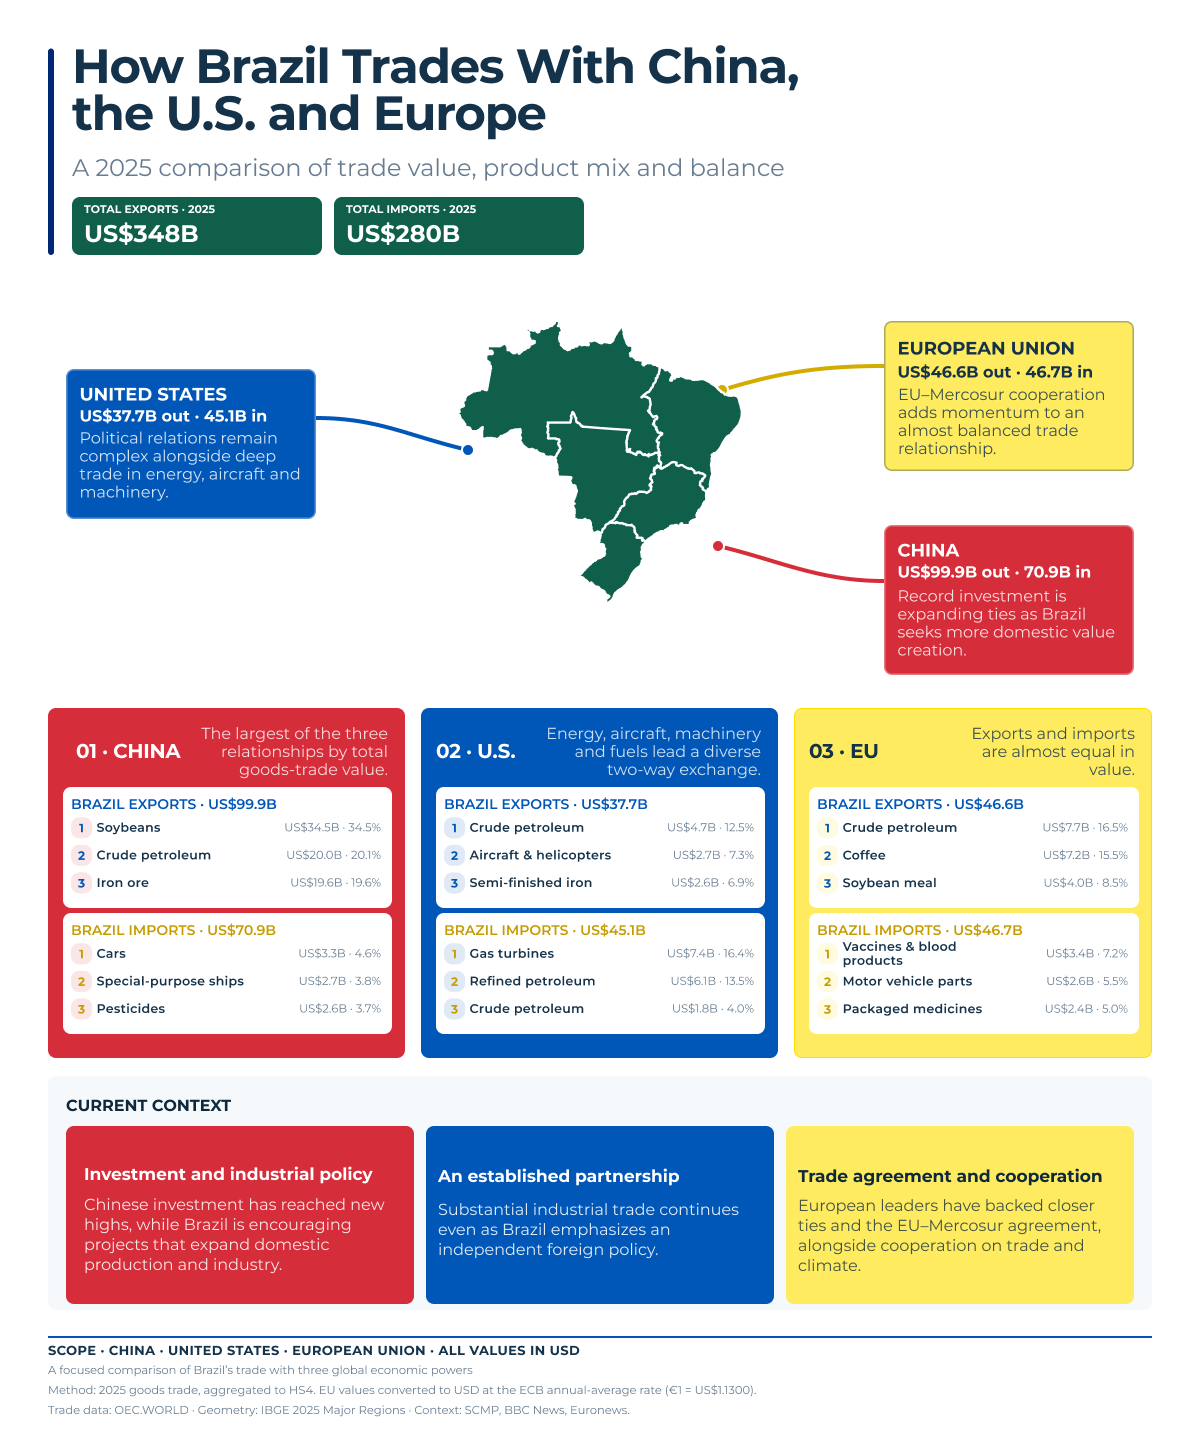
Brazil’s latest election result has already sparked discussion about how the country’s most important international relationships will develop.
President Luiz Inácio Lula da Silva’s re-election comes amid political friction with the United States, record Chinese investment and a closer European partnership supported by the EU–Mercosur agreement.
Each relationship offers Brazil something different. China brings enormous demand and investment. The United States remains an important industrial and energy partner. Europe combines trade with cooperation on climate and multilateral policy.
The trade data helps explain what is at stake.
Brazil exported US$348 billion in goods and imported US$280 billion in 2025, producing a trade surplus of approximately US$68 billion. Its exchanges with China, the U.S. and the European Union, however, followed three different patterns.
China: scale and investment
Brazil exported US$99.9 billion to China and imported US$70.9 billion, producing a bilateral surplus of roughly US$29 billion.
The relationship is heavily concentrated in commodities. Soybeans, crude petroleum and iron ore represented more than 74% of Brazil’s exports to China.
China is also becoming an increasingly important investor. Brazil welcomes that capital but wants more projects that support domestic production, infrastructure and industrial development—not only commodity trade. South China Morning Post
United States: industry and energy
Brazil exported US$37.7 billion to the U.S. and imported US$45.1 billion.
The relationship is more diversified than Brazil’s trade with China. Petroleum, aircraft and semi-finished iron lead Brazilian exports, while gas turbines and refined petroleum are among its largest imports.
These flows connect the two countries through industrial and energy supply chains. Politically, however, Brazil continues to emphasize an independent foreign policy rather than automatic alignment with Washington. BBC News
European Union: an almost perfect balance
Brazil exported US$46.6 billion to the EU and imported US$46.7 billion—a difference of just US$100 million.
Brazil primarily sends energy and agricultural products, while Europe supplies pharmaceuticals, vehicle components and other manufactured goods.
The EU–Mercosur agreement could deepen this already substantial relationship. European leaders have also positioned Brazil as an important partner on trade, climate and the multilateral system. Euronews
Three relationships, three roles
China provides scale and investment. The United States offers industrial integration. Europe brings balance and institutional cooperation.
The question following Brazil’s election is not simply which power the country will move closer to. It is how Brazil will use all three relationships to expand exports, attract investment and create more value at home.
Sources: 2025 goods-trade data from OEC.WORLD, aggregated to HS4. EU values were converted to U.S. dollars using the 2025 annual-average ECB exchange rate of €1 = US$1.1300.
r/Infographics • u/Zarykata • 1d ago
r/Infographics • u/Lucky_Creme_5208 • 12h ago
Especially Oxford.
Don't get me started on Numbeo - they have completely different cities going on there.
Which one represent the reality the best?
(EIU and Monocle agree with each other the most - having 5 cities in common, whereas Oxford is having a complete different list.)
r/Infographics • u/PuzzleheadedEmu4596 • 1d ago
r/Infographics • u/NBrief • 1d ago
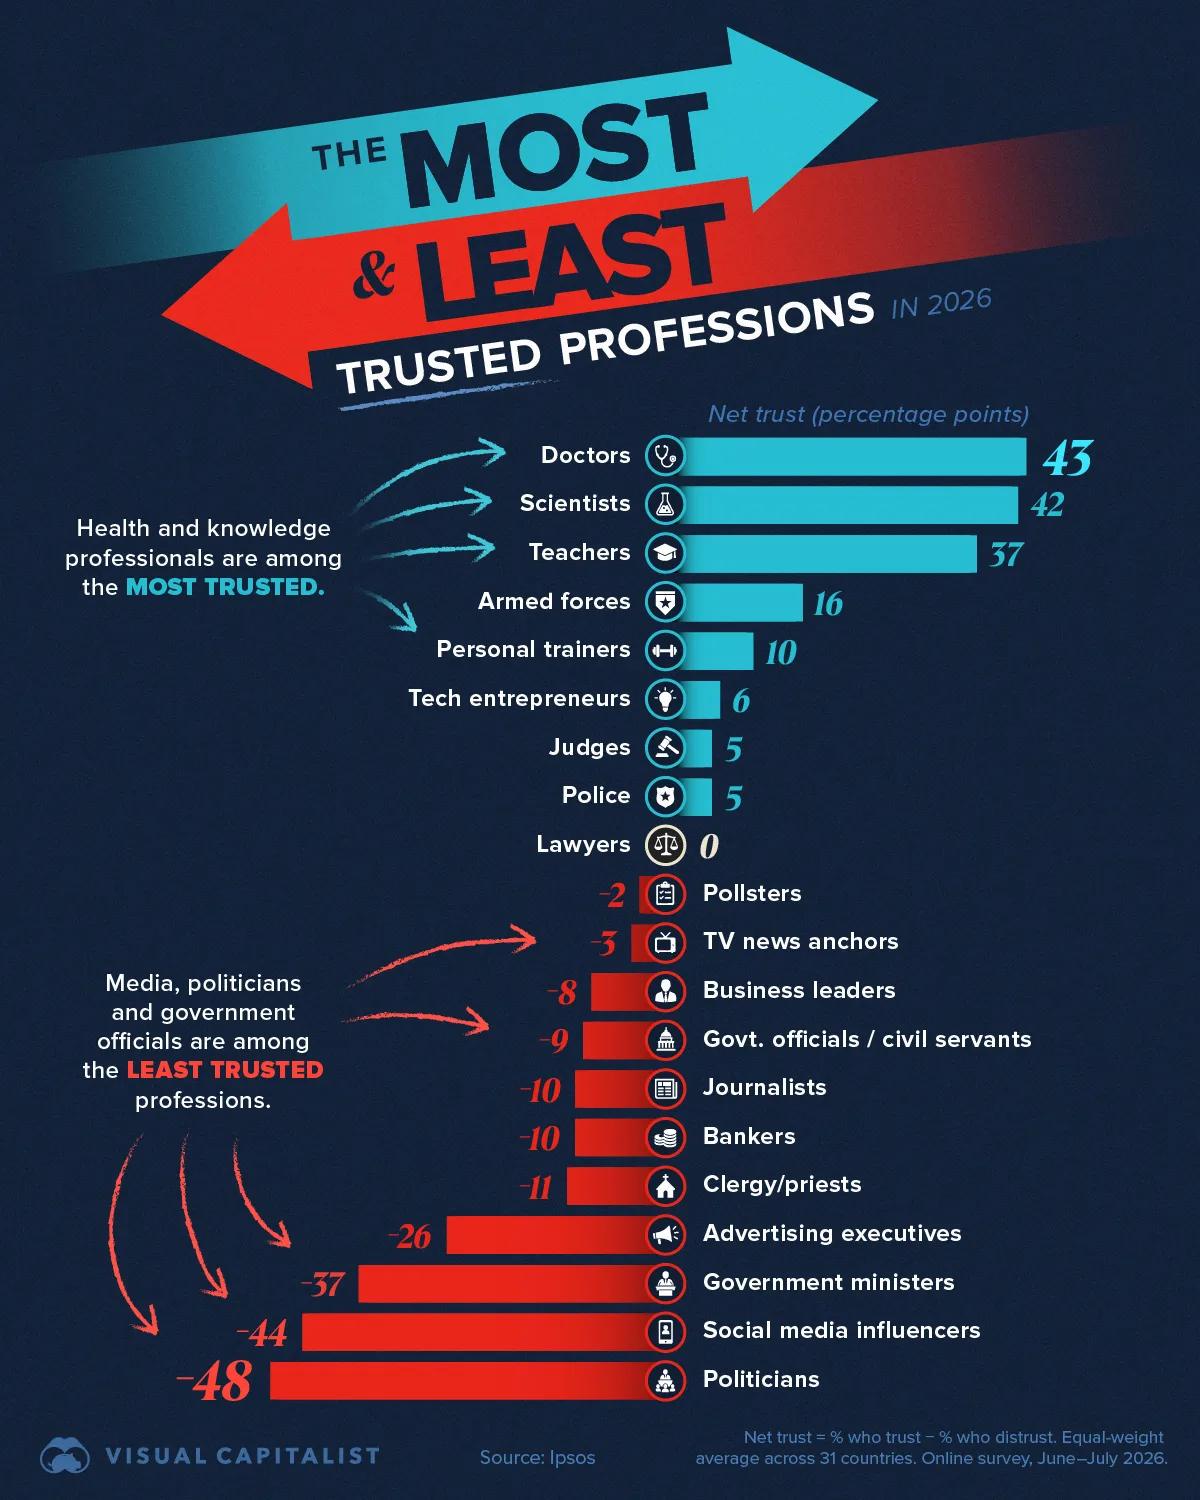
Net trust = % who trust - % who distrust. Equal-weight average across 31 countries. Online survey, June-July 2026
Source: Ipsos
r/Infographics • u/Hollingsworthin • 21h ago
r/Infographics • u/joshtaco • 2d ago