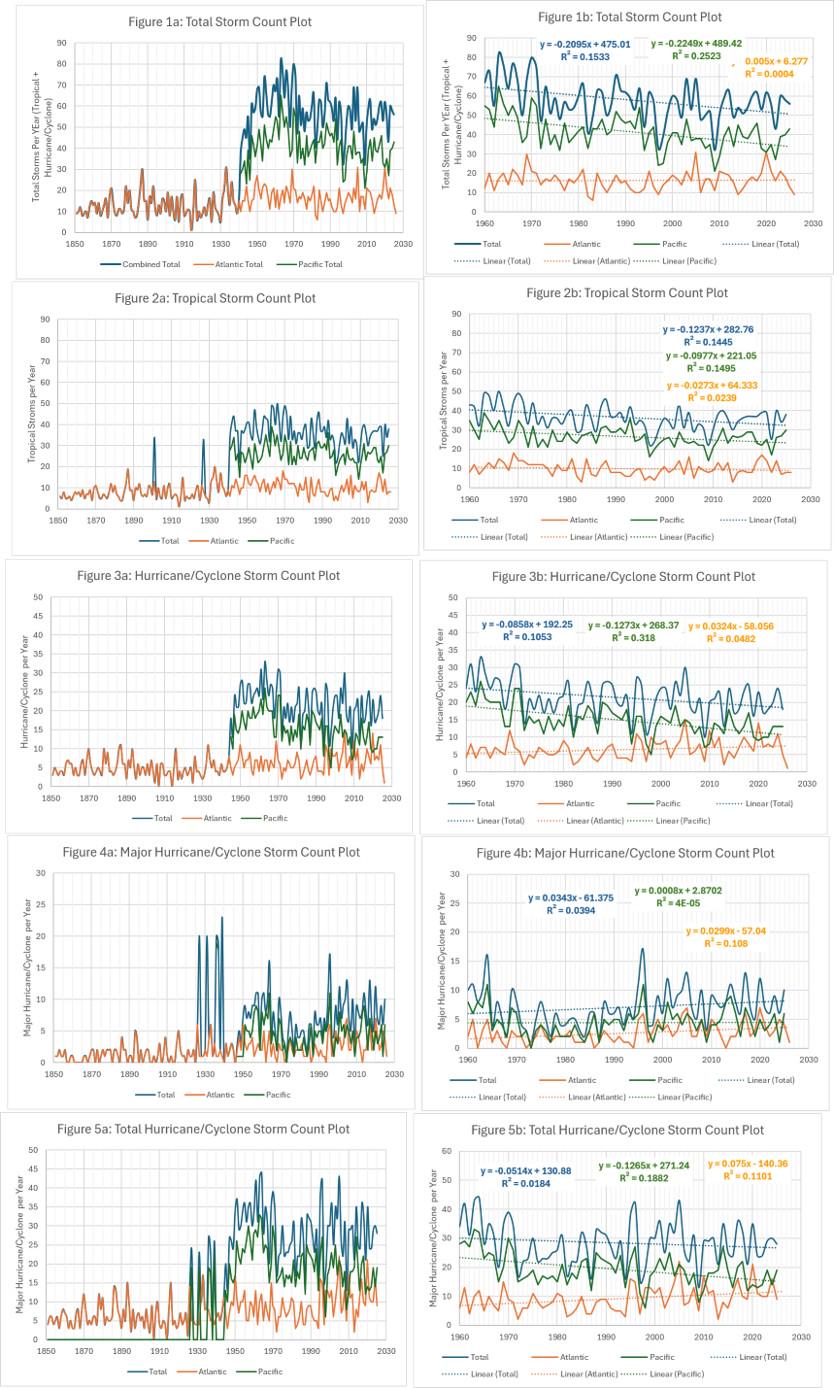
This is the first in a series of presentations to examine and discuss the frequency of tropical disturbances. Then there will be a discussion of the impacts of the disturbances.
Source Data:
List of Atlantic hurricane seasons - Wikipedia
Pacific hurricane - Wikipedia
Note 1: the data sets were cross-referenced against the NHIC and some minor differences were corrected with the NHIC being the preferred data sets
Definition: tropical disturbance is classified as a tropical storm, hurricane, major hurricane, typhoon or super typhoon.
Note 2: tropical depressions were excluded as the records are not of sufficient length to be of use and only available in the Atlantic basin from the data sets used.
Constraint 1: The numerical observation and analysis of the data sets has been set to 1960 in this study to correspond with the advent weather satellites.
Observations:
1. From Figures 1a, 2a, 3a and 4a we can see that there is a marked increase in storm counts near 1940.
a. Could be due to more traffic due to WWII?
2. From Figure 1b we can see that the incident rates per year are:
a. Total decreases from 64.4 to 50.6 storms per year (13.8 storms, -21.5%)
b. Pacific decreases from 48.6 to 33.8 storms per year (14.8 storms, -30.5%)
c. Atlantic increases from 16.1 to 16.4 storms per year (0.3 storms, +2.1%)
3. From Figure 2b we can see that the incident rates per year are:
a. Total decreases from 40.3 to 32.1 (-8.2 storms, -20.3%)
b. Pacific decreases from 19.6 to 13.1 (-6.4 storms, -33.0%)
c. Atlantic decreases from 10.8 to 9.0 (-1.8 storms, -16.6%)
4. From Figure 3b we can see that the incident rates per year are:
a. Total decreases from 21.4 to 18.4 (-5.7 storms, -23.5%)
b. Pacific decreases from 18.9 to 10.5 (-8.4 storms, -44.5%)
c. Atlantic increases from 5.4 to 7.6 (+2.1 storms, +39.3%)
5. From Figure 4b we can see that the incident per year rates are:
a. Total increases from 5.9 to 8.1 (+2.3 storms, +38.7%)
b. Pacific increases from 4.4 to 4.5 (0.1 storms, +1.2%)
c. Atlantic increases from 1.6 to 3.5 (+2.0 storms, +126.2%)
6. From Figure 5b we can see that the incidence rate per year are:
a. Total decreases from 30.1 to 26.7 (-3.4 storms, -11.3%)
b. Pacific decreases from 23.3 to 15.0 (-8.3 storms, -35.8%)
c. Atlantic increases from 6.6 to 11.6 (+4.9 storms, +74.5%)
This is the end of the first post. Tune in for a discussion of the data and further analysis in later episodes.