r/dataisugly • • Sep 20 '24

Advice Misleading graphs for 5th graders
Post image
1.8k Upvotes

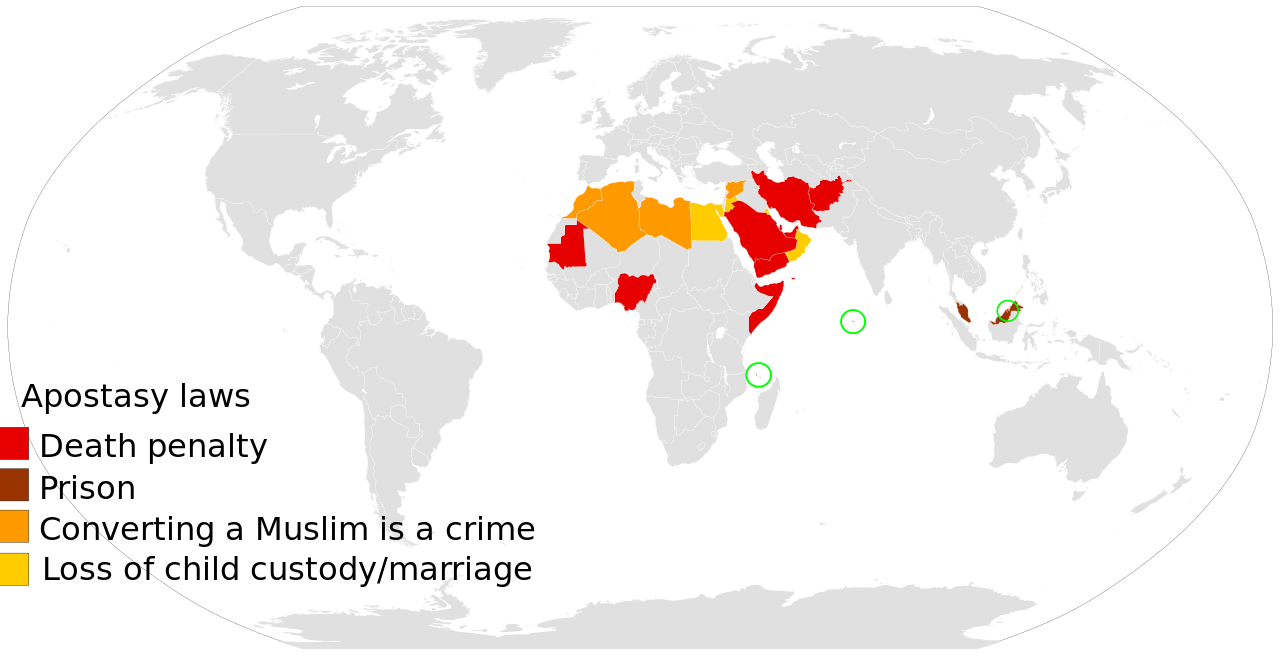
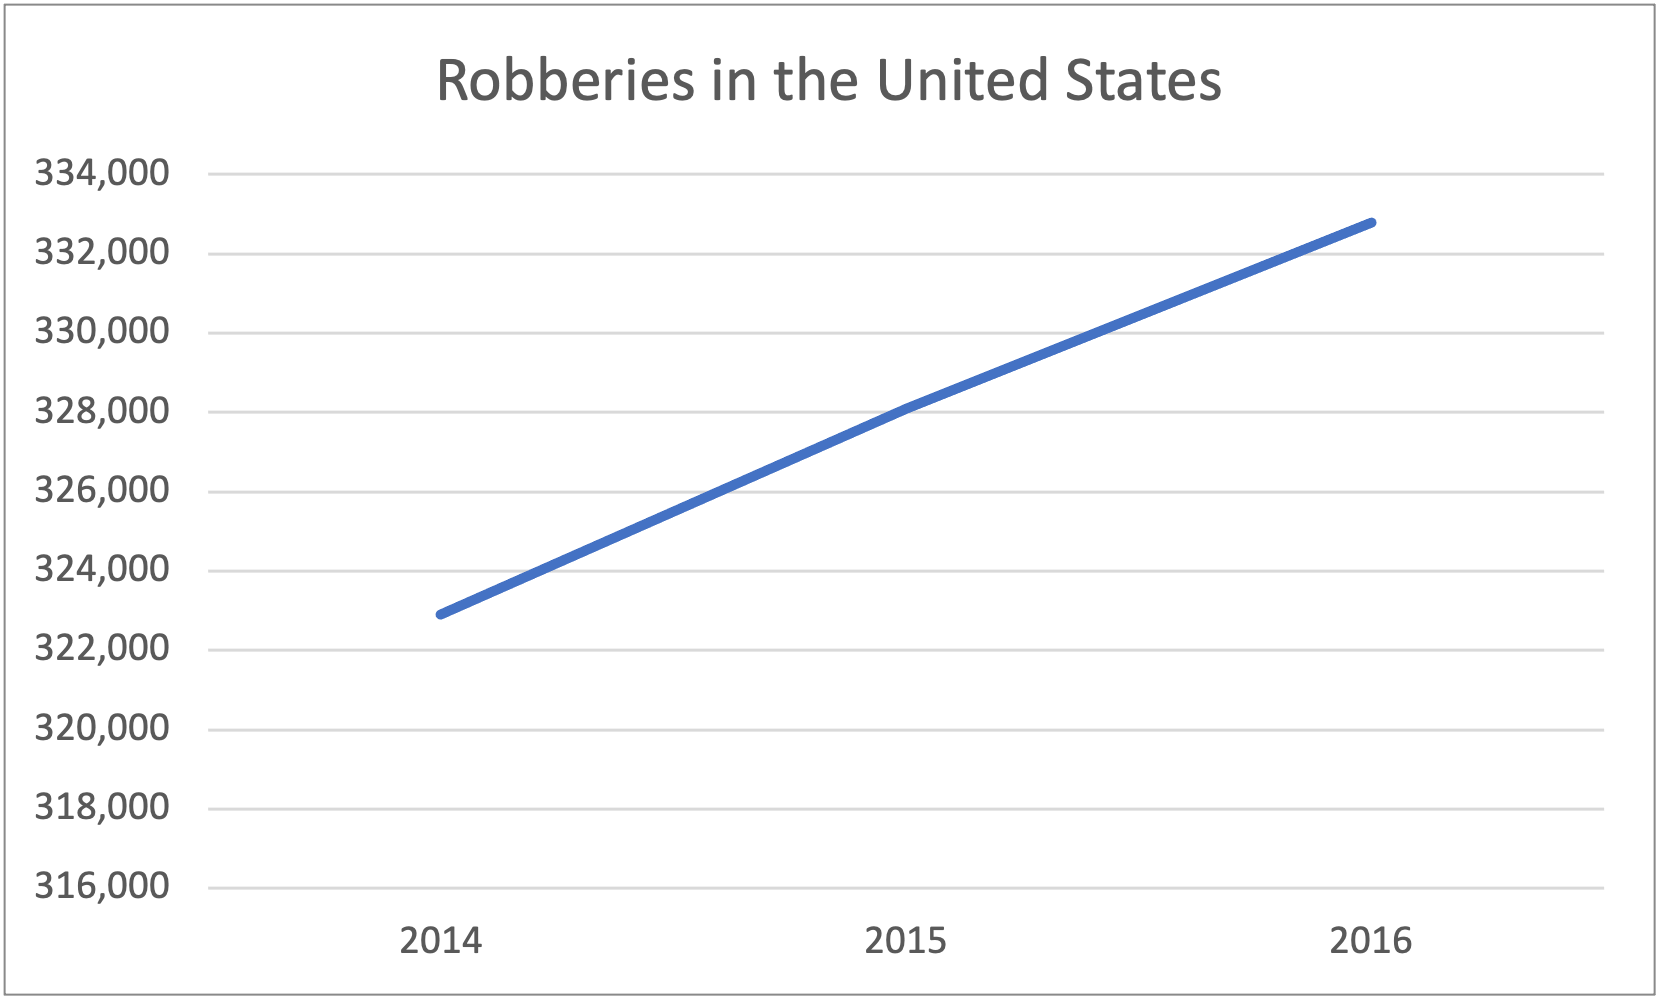
I'm in charge of teaching math this module for the 5th grade team and I want to create a lesson that helps the students identify misleading graphs, what about them makes them misleading, and how to fix them. So, please offer all of your 5th-grade-friendly misleading graphs for me to use in the lesson!

r/dataisugly • • Feb 24 '25

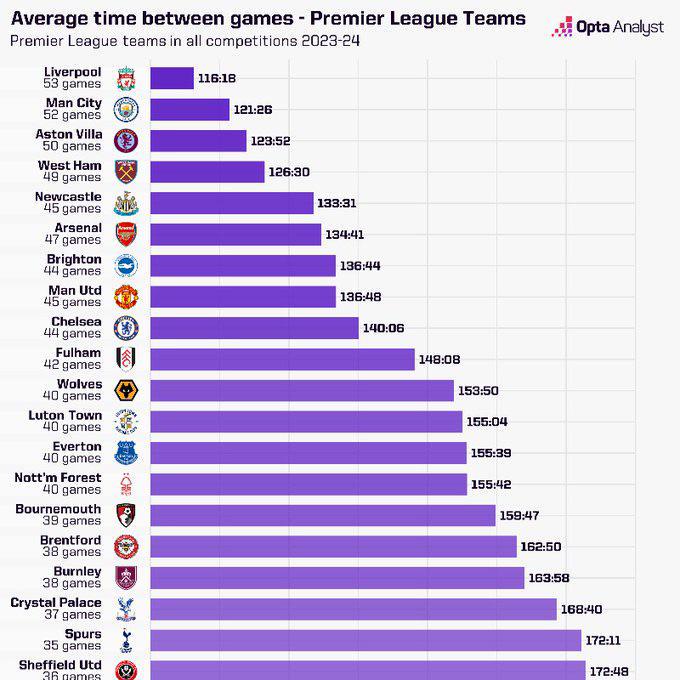
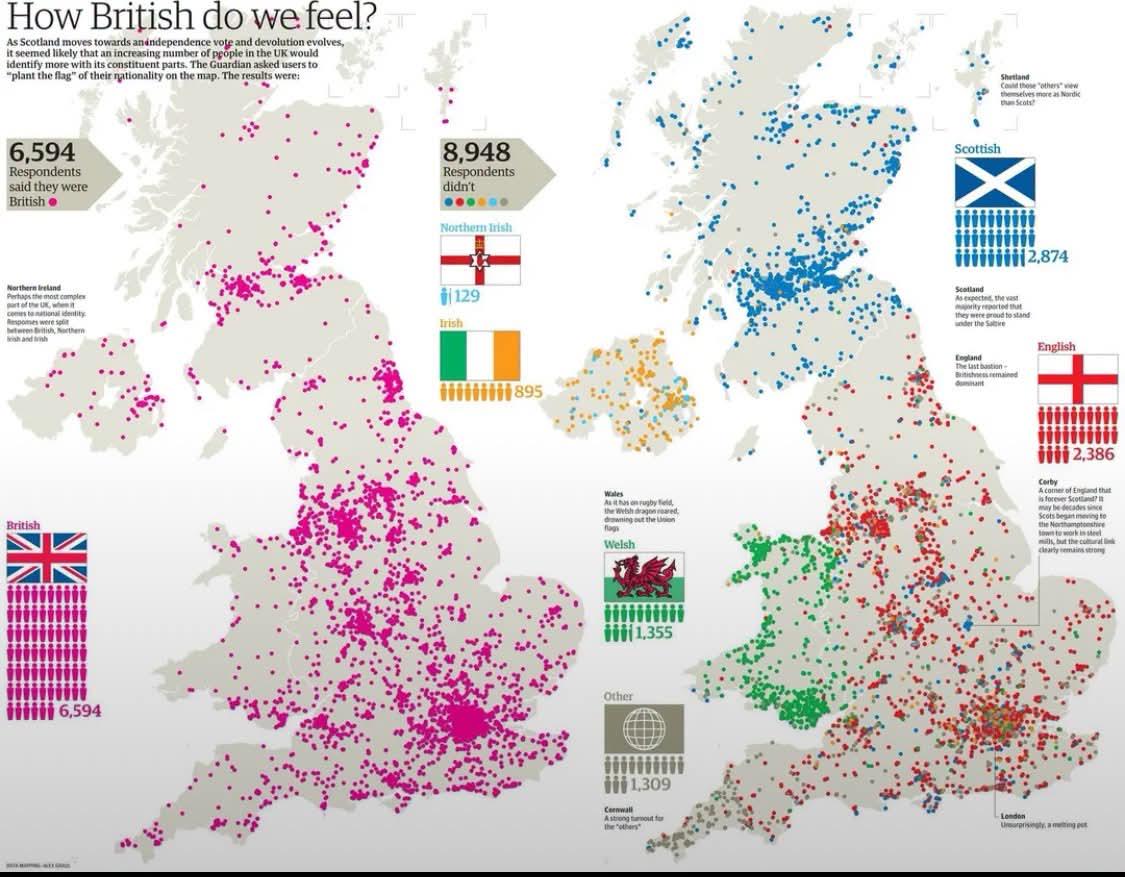
Advice this data ISNT ugly but I have seen it bouncing around some circles saying that it is - do you guys see anything wrong with this?

Post image
457 Upvotes

r/dataisugly • • 3d ago

Advice where people live

Post image
37 Upvotes

r/dataisugly • • 28d ago

Advice Writing a report on a dataset, decided to start off by showing all data points by themselves like this. Too basic? Too squeezed to take up a third of a PDF page? Roast the hell out of this

Post image
8 Upvotes

r/dataisugly • • Feb 13 '26

Advice Is this ugly or not? It looked very weird to me at first glance, but on the second I can't quite specify it. The values are relatively close so it make sense the put only 6,9 to 8,1 and .10 to .050 there, it's properly labeled... But the actual links seem kinda weird? Are they correct?

Post image
69 Upvotes

r/dataisugly • • 18d ago

Advice What does this data mean how to analyse and understand it

Post image
0 Upvotes

r/dataisugly • • Feb 10 '26

Advice Not obvious manipulations

Post image
46 Upvotes

Hi redittors! I am in search of the subtlest manipulations with dataviz or data in general that you can think of - will you please hit me with your best/worst? The context is a citizen education event. Cheers!

(super noisy and messed up charts do count!)

r/dataisugly • • Nov 26 '21

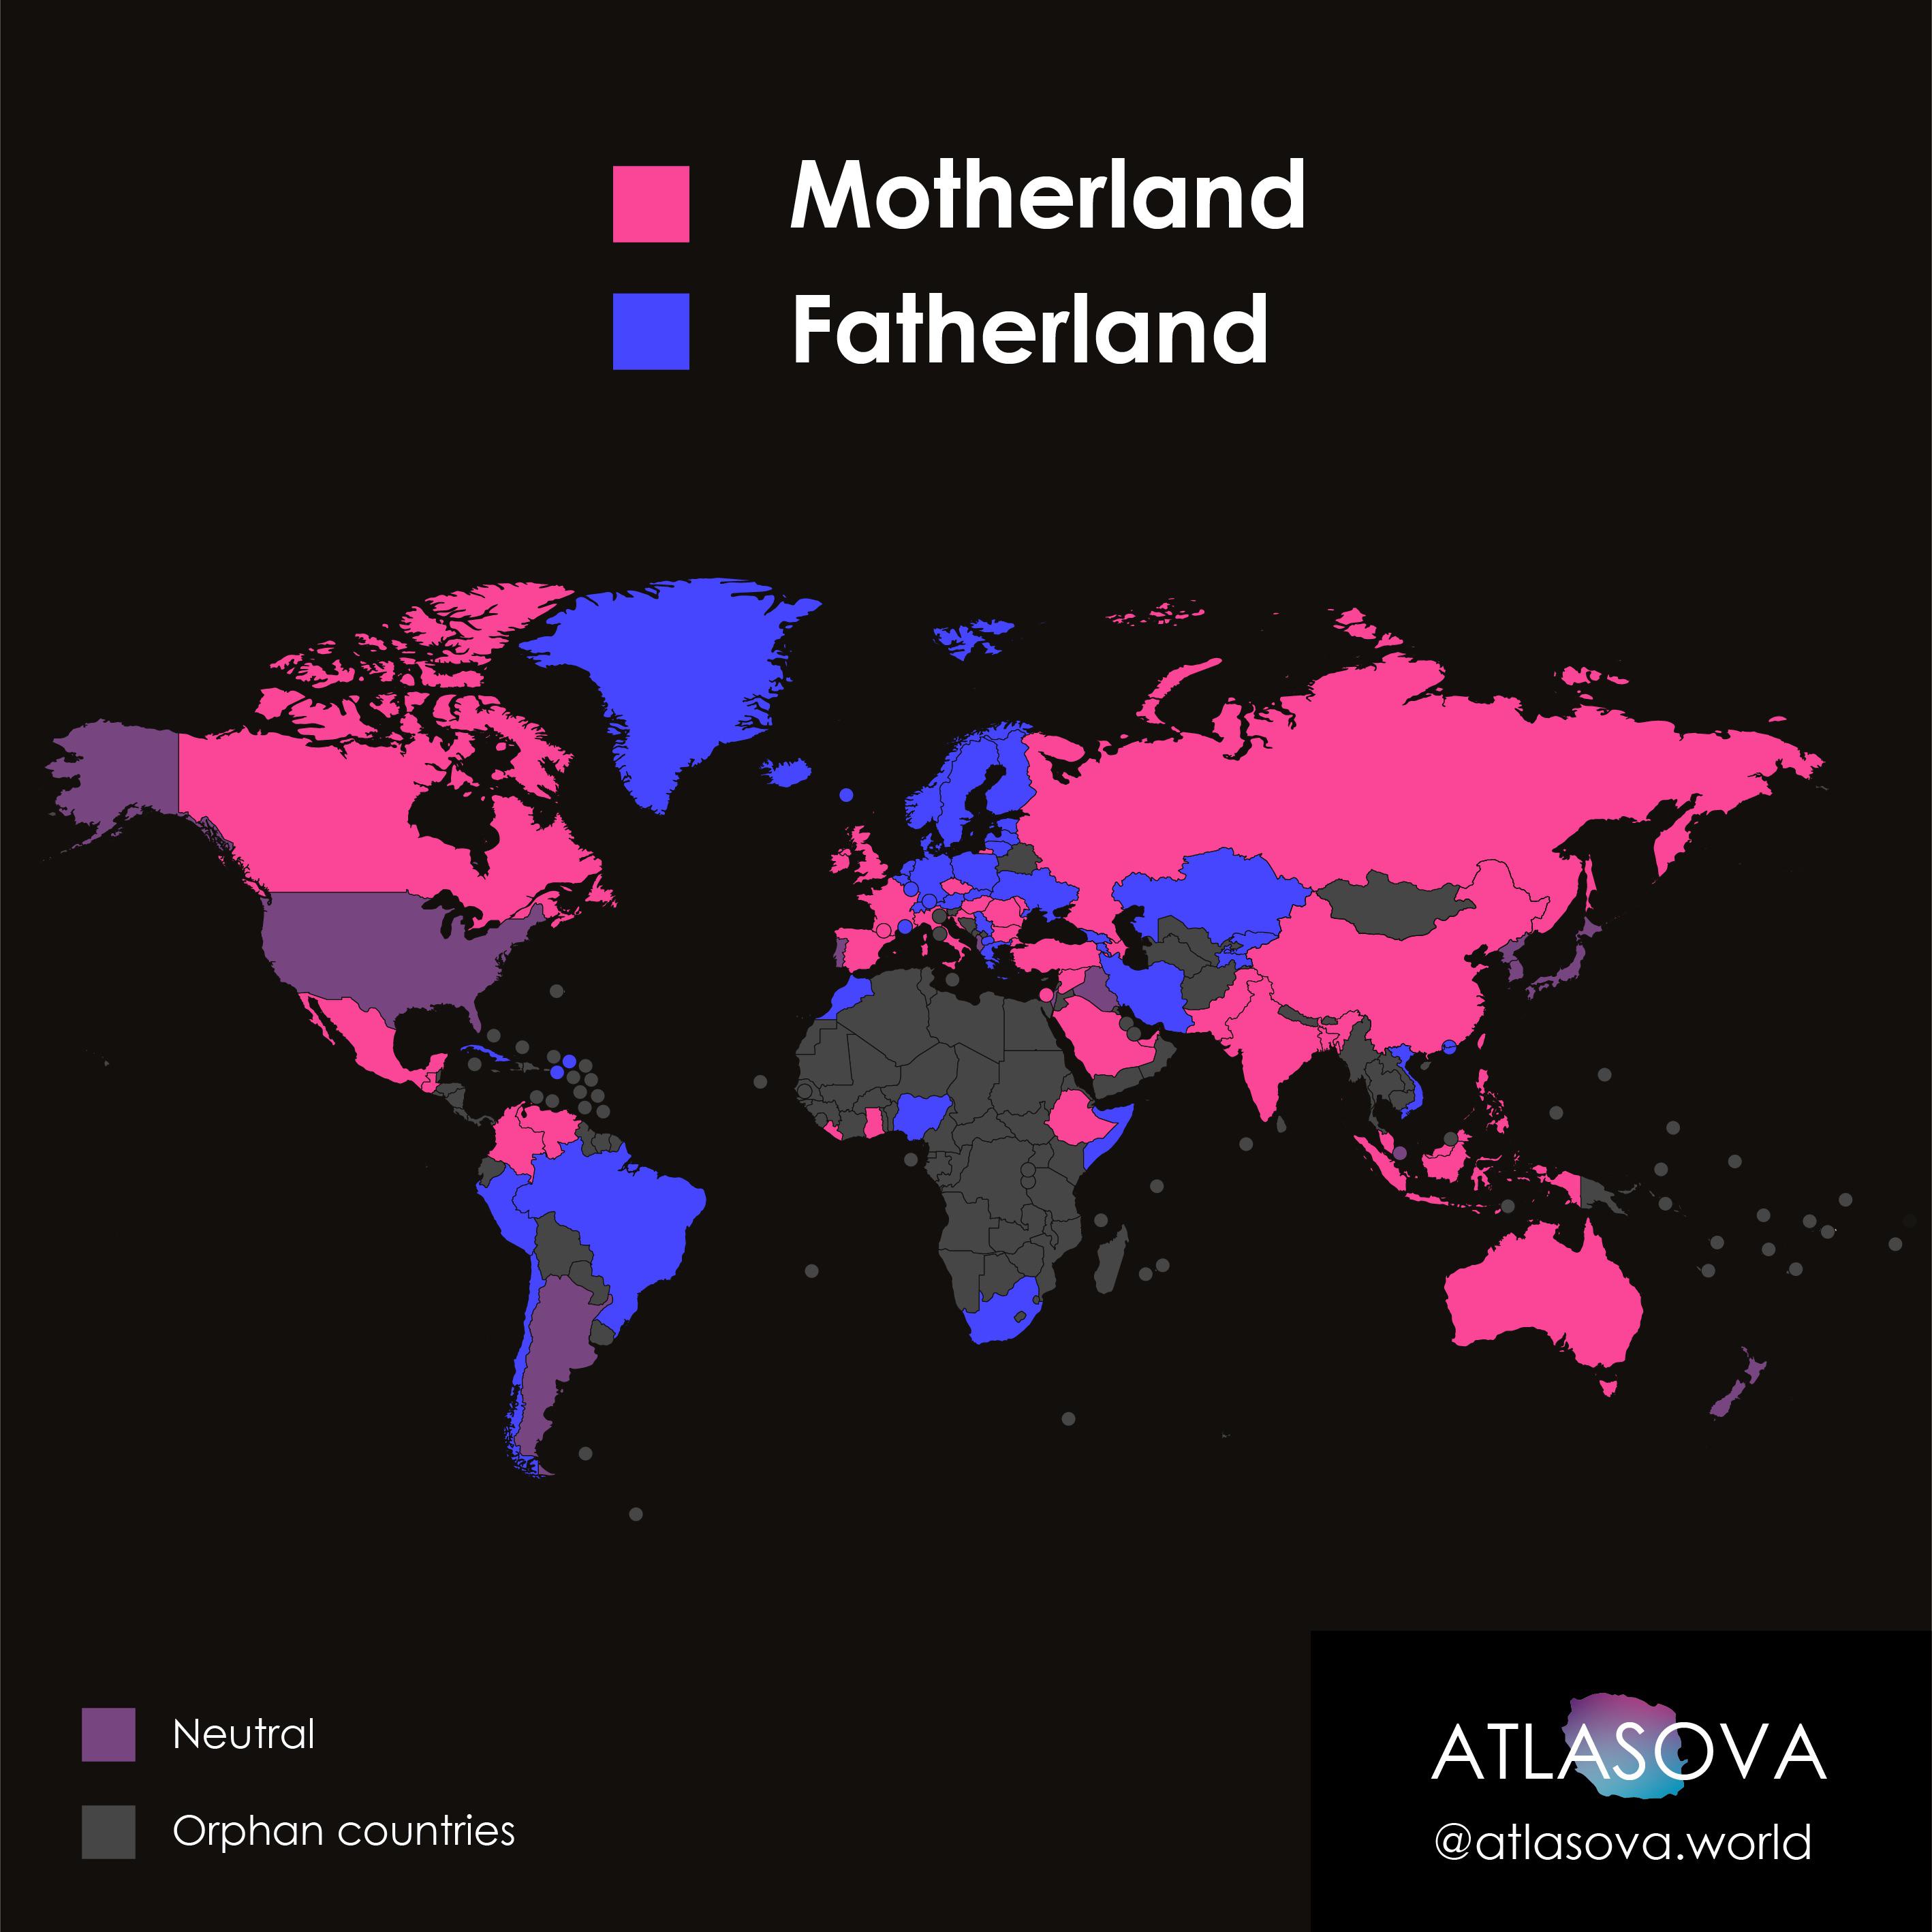
Advice Global map of "How people call their homeland" uses 400 Instagram respondents.

Post image
488 Upvotes

r/dataisugly • • Apr 04 '26

Advice The idea is interesting, how to better execute?

Post image
0 Upvotes

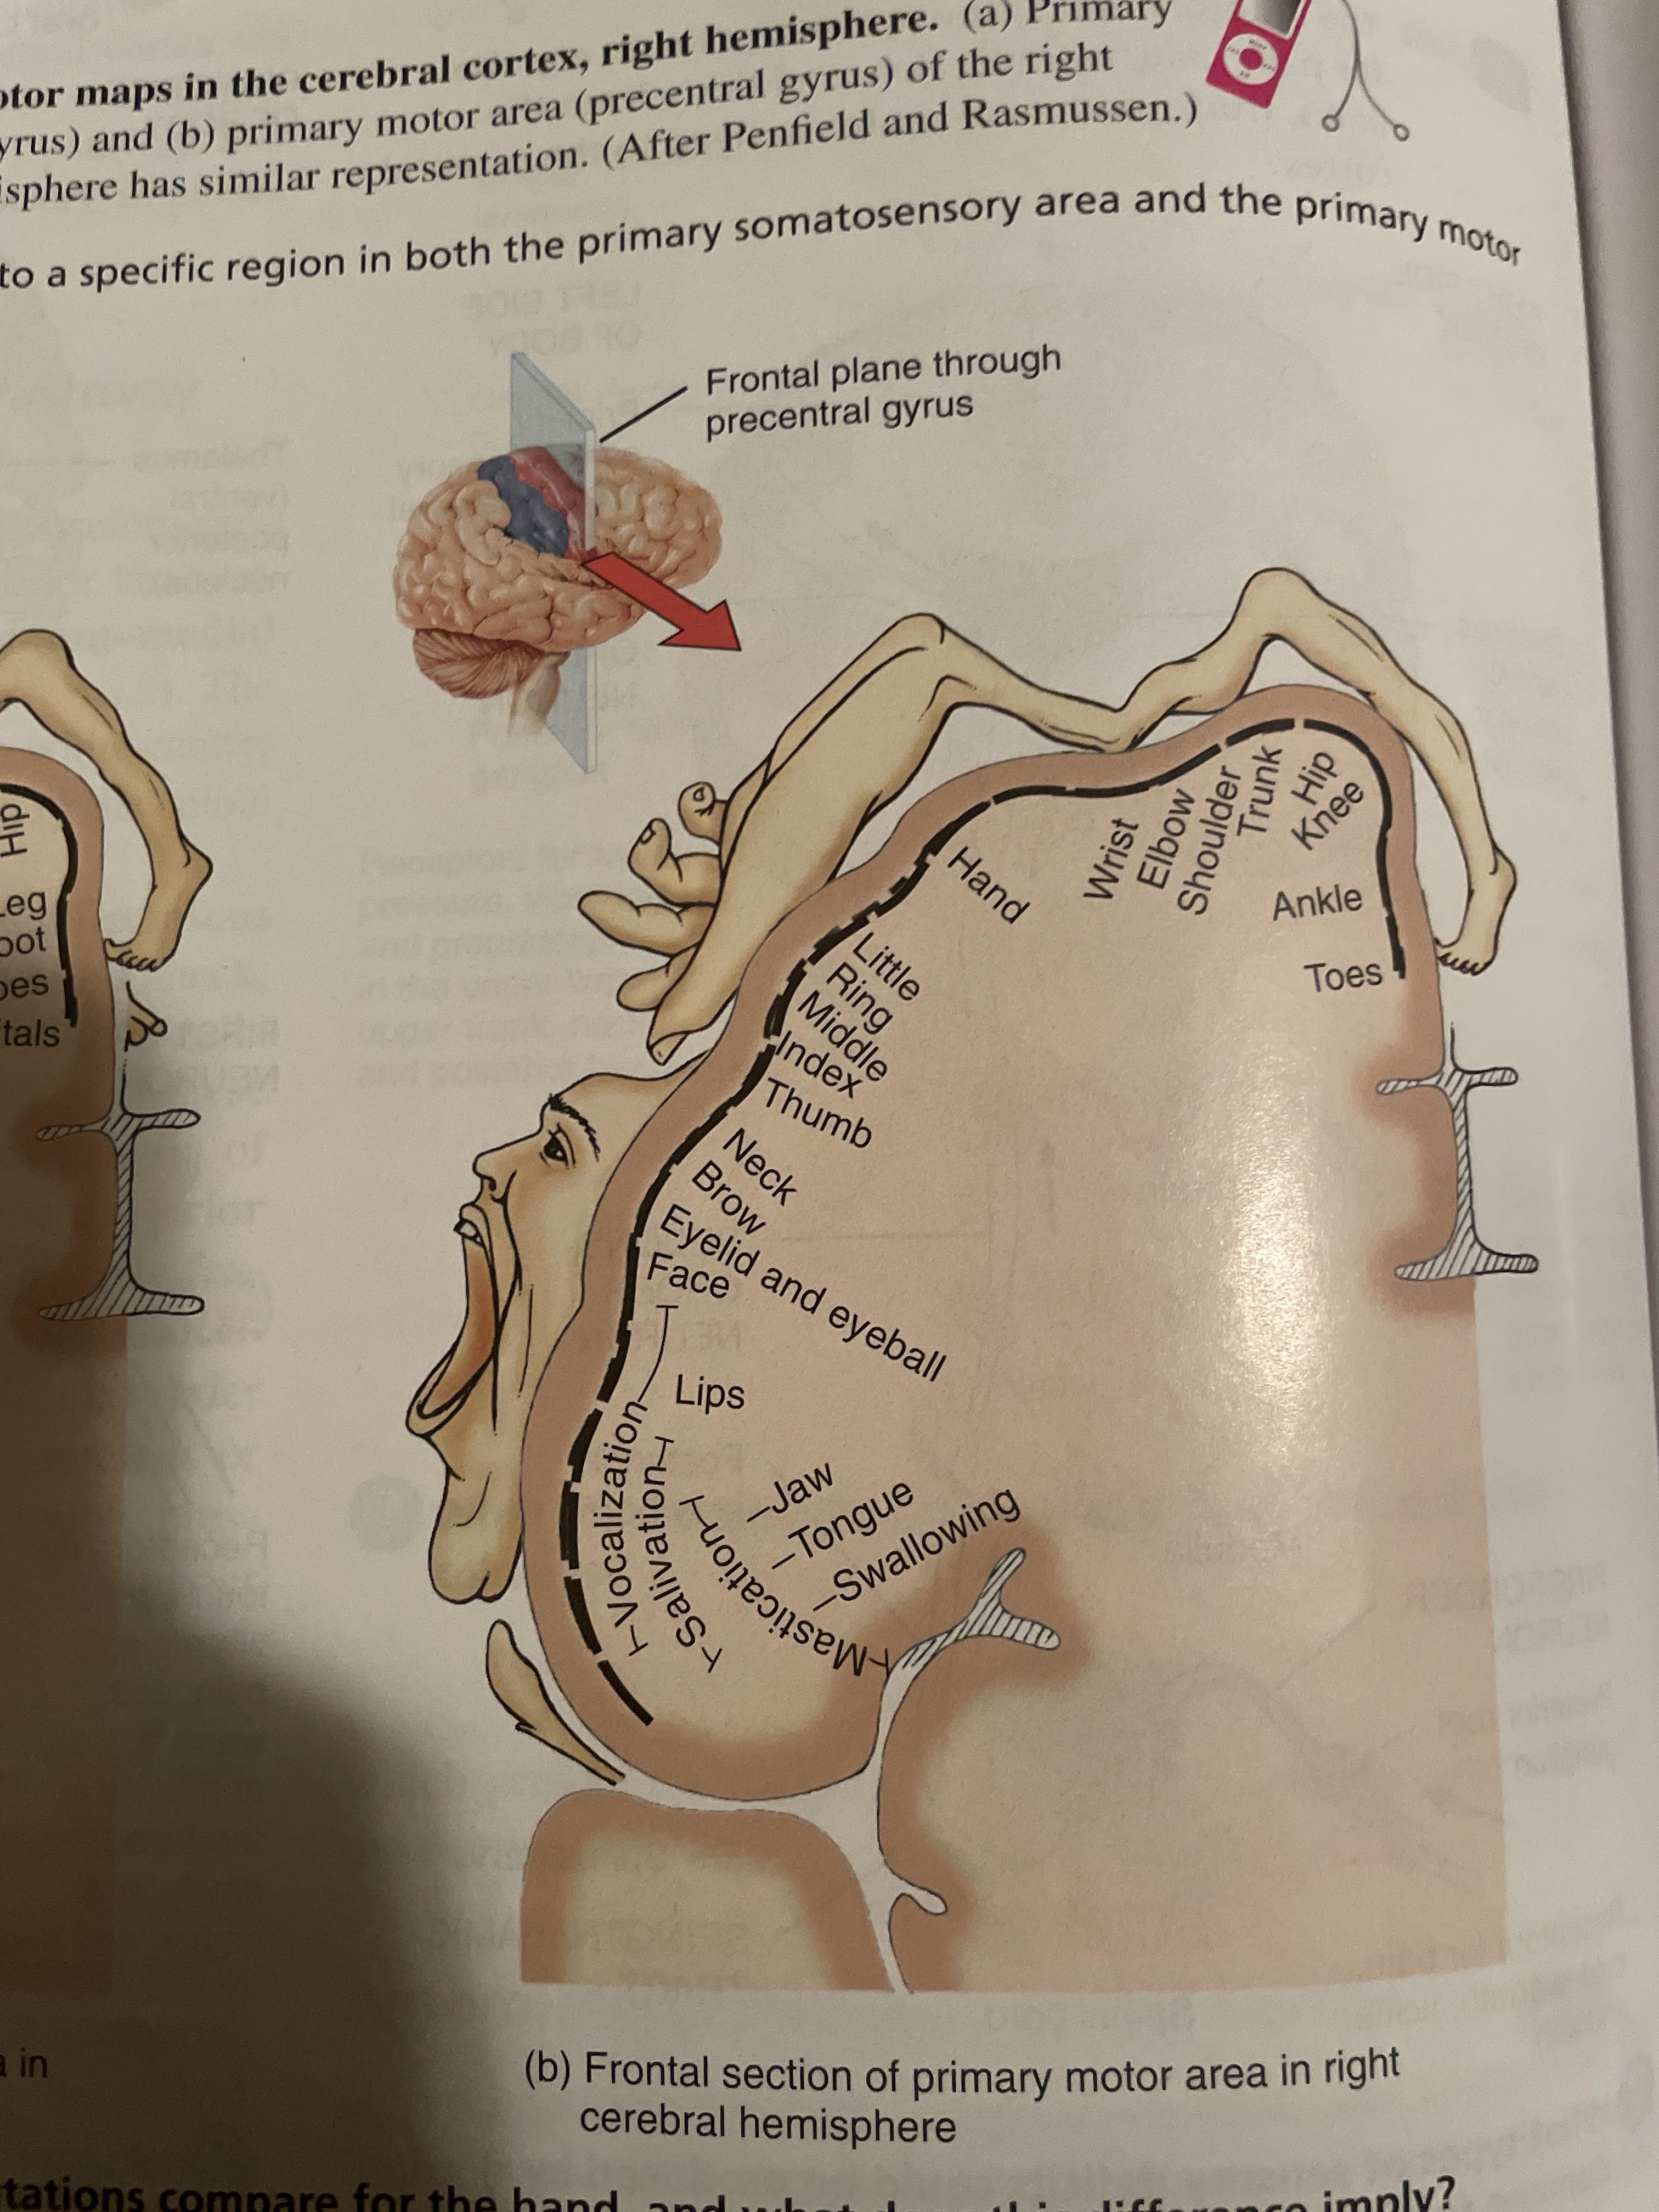
The idea of mapping the parts of the brain to the parts of body they control is interesting. The execution does an ok job of showing how many more nerves are dedicated to the face and hands then to the rest of the body--but not in a super intuitive way.

Would it be possible to do something simjlar but really well-executed?

r/dataisugly • • Jul 10 '26

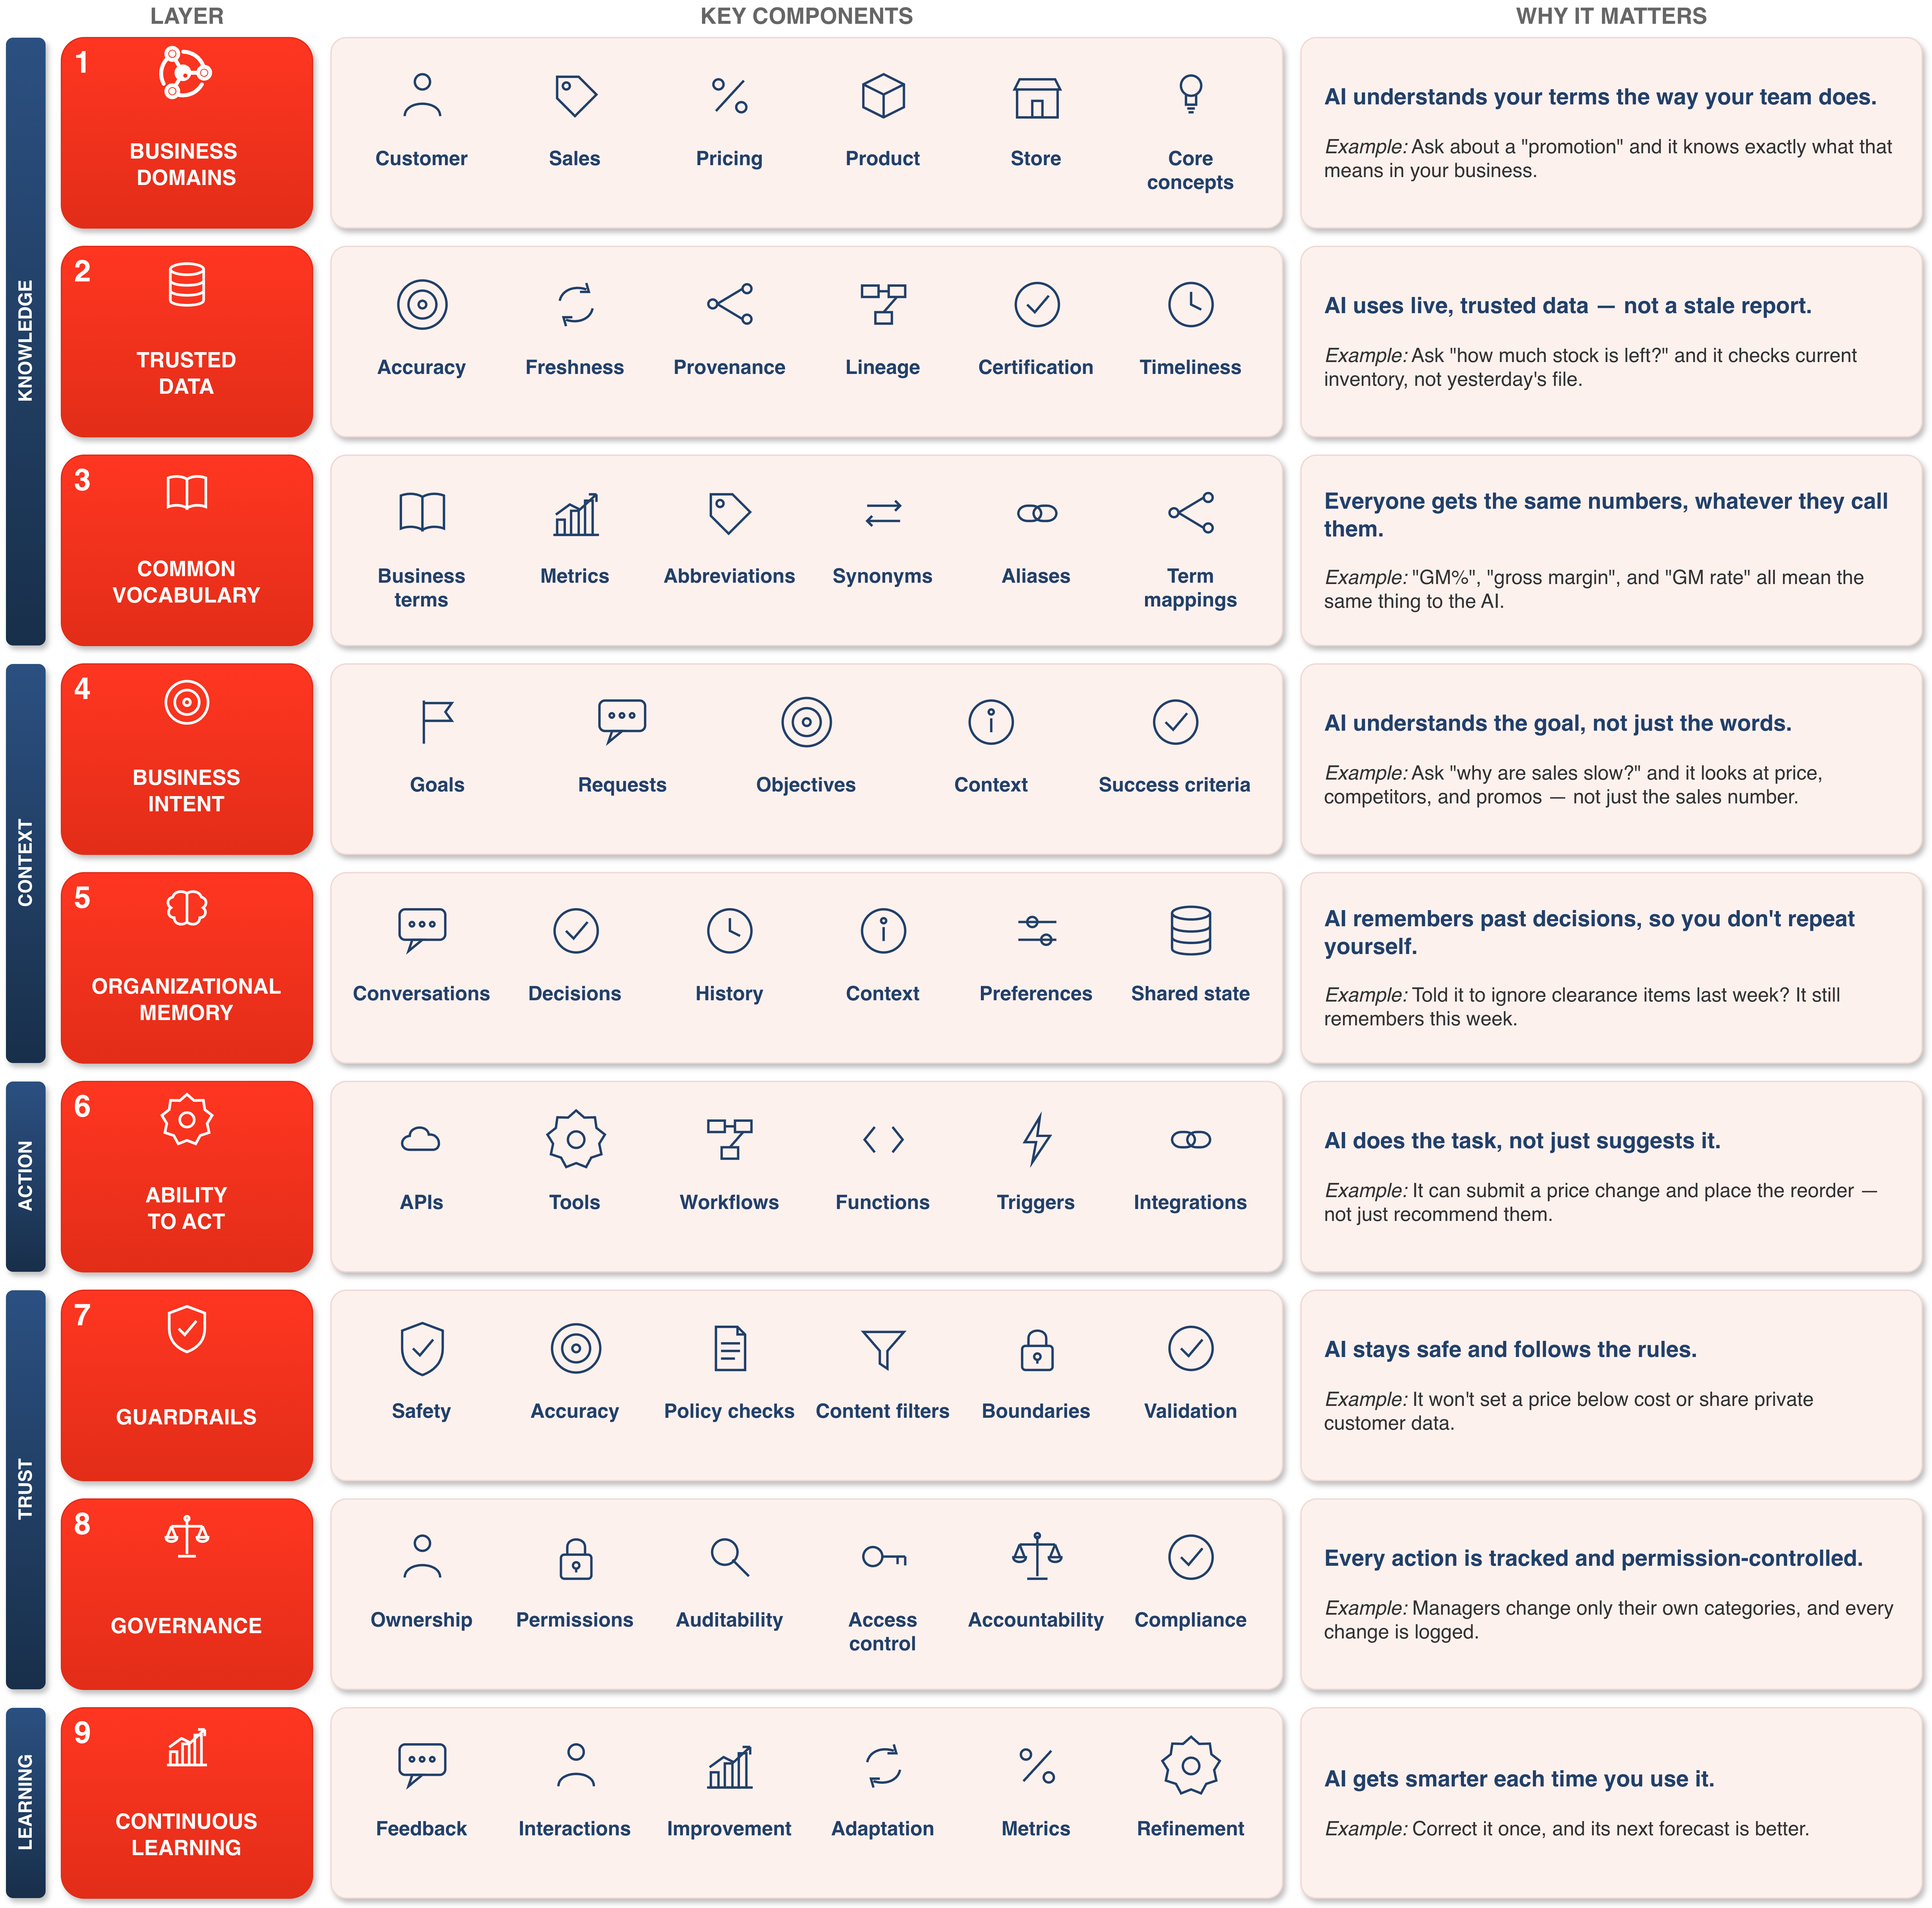
Advice We Are Making the Same Mistake with Enterprise AI That We Made with Data

Post image
1 Upvotes

r/dataisugly • • Feb 13 '26

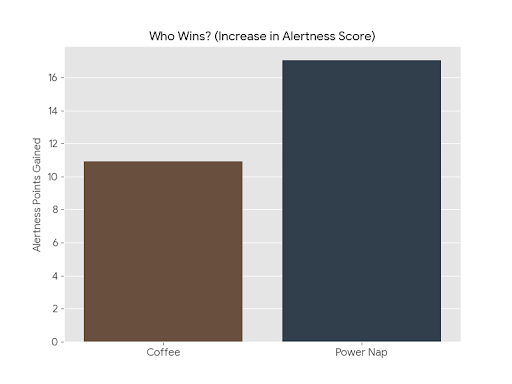
Advice tmaf "Coffee vs. Naps" .. amazing results

Post image
0 Upvotes

r/dataisugly • • Feb 10 '26

Advice My Cloud Based Analytics Professor was showing this document published by Tableau Public as a good data visualization resource. I feel like this first visualization isn't a good one. Am I wrong?

Post image
3 Upvotes

r/dataisugly • • Mar 15 '26

Advice A bit of help

Thumbnail reddit.com
5 Upvotes

r/dataisugly • • Mar 07 '26

Advice How is my data study on 2025 Colorado intersection crashes? šŸ¤”

Thumbnail
ridderlaw.com
1 Upvotes

r/dataisugly • • Nov 28 '25

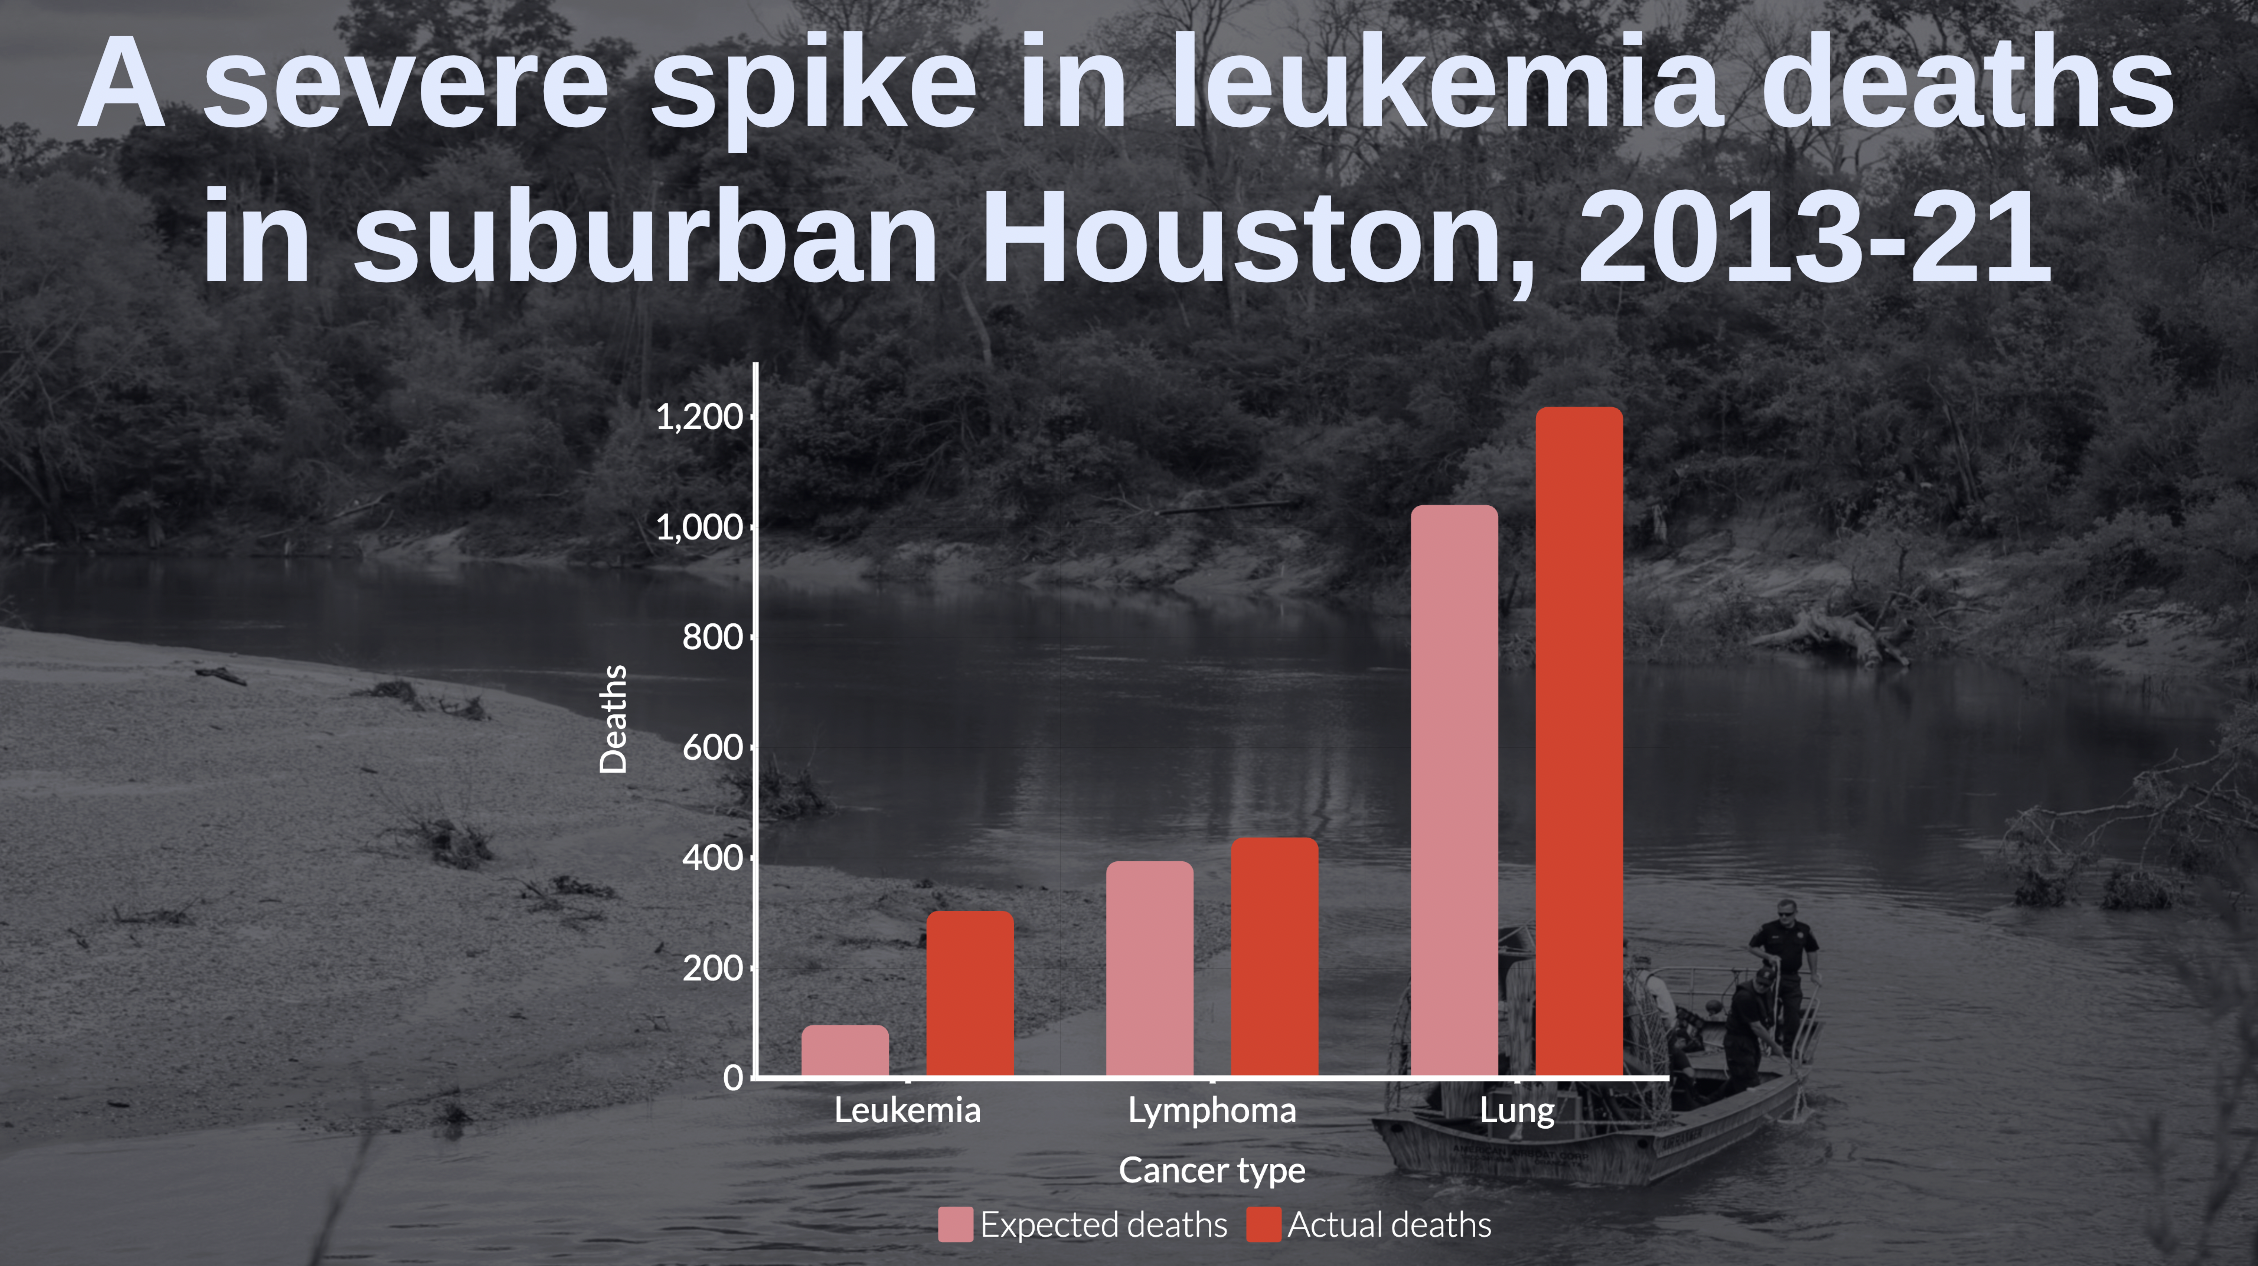
Advice Between 2013-21, 304 people died from leukemia—blood cancer—in suburban Houston. This was 212% higher than the leukemia death rate in the rest of TX, and indicates a severe cancer cluster. Nearby is a Superfund site contaminated with toxic waste. "Residents say they swam and fished near and on top"

Post image
5 Upvotes

r/dataisugly • • Apr 29 '24

Advice Not that bad, but curious if people would change anything about this visualization

Post image
48 Upvotes

r/dataisugly • • Aug 20 '25

Advice Labeling 10k sentences manually vs letting the model pick the useful ones šŸ˜‚ (uni project on smarter text labeling)

Post image
0 Upvotes

Hey everyone, I’m doing a university research project on making text labeling less painful.
Instead of labeling everything, we’re testing anĀ Active Learning strategyĀ that picks the most useful items next.
I’d love to askĀ 5 quick questionsĀ from anyone who has labeled or managed datasets:
– What makes labeling worth it?
– What slows you down?
– What’s a big ā€œdon’t doā€?
– Any dataset/privacy rules you’ve faced?
– How much can you label per week without burning out?

Totally academic, no tools or sales. Just trying to reflect real labeling experiences

r/dataisugly • • Sep 17 '25

Advice Looking for a graph

Thumbnail google.com
1 Upvotes

(Attachment to google added because i needed to attach a file to make this post) Hello Everyone! I am looking for a specific graph I saw years ago, to use for a statistics class. I remembered it emphasized Correlation is NOT Causation. The data I remember that was involved was something about Nicholas Cage and amount of people drowning that year. Does anyone know what I'm talking about?

r/dataisugly • • Jul 26 '24

Advice Maybe don't use 2 similar reds

Post image
51 Upvotes

r/dataisugly • • Mar 03 '24

Advice Does anyone know what type of graph is this ?

Post image
42 Upvotes

r/dataisugly • • Jan 27 '23

Advice Y'all seemed to love it so I spent another 30 minutes on it just for you. It's ugly because the data isn't weighted in any way nor are differences in the actual metrics shown, just ranked

Post image
32 Upvotes

r/dataisugly • • Apr 30 '24

Advice Measuring the difference between literal children and young adults, then presenting the *difference* in a weird bar chart, where a bigger number means less trust? Also, K-12, aged 12-18? That's not what K-12 means.

Post image
0 Upvotes

r/dataisugly • • Dec 17 '23

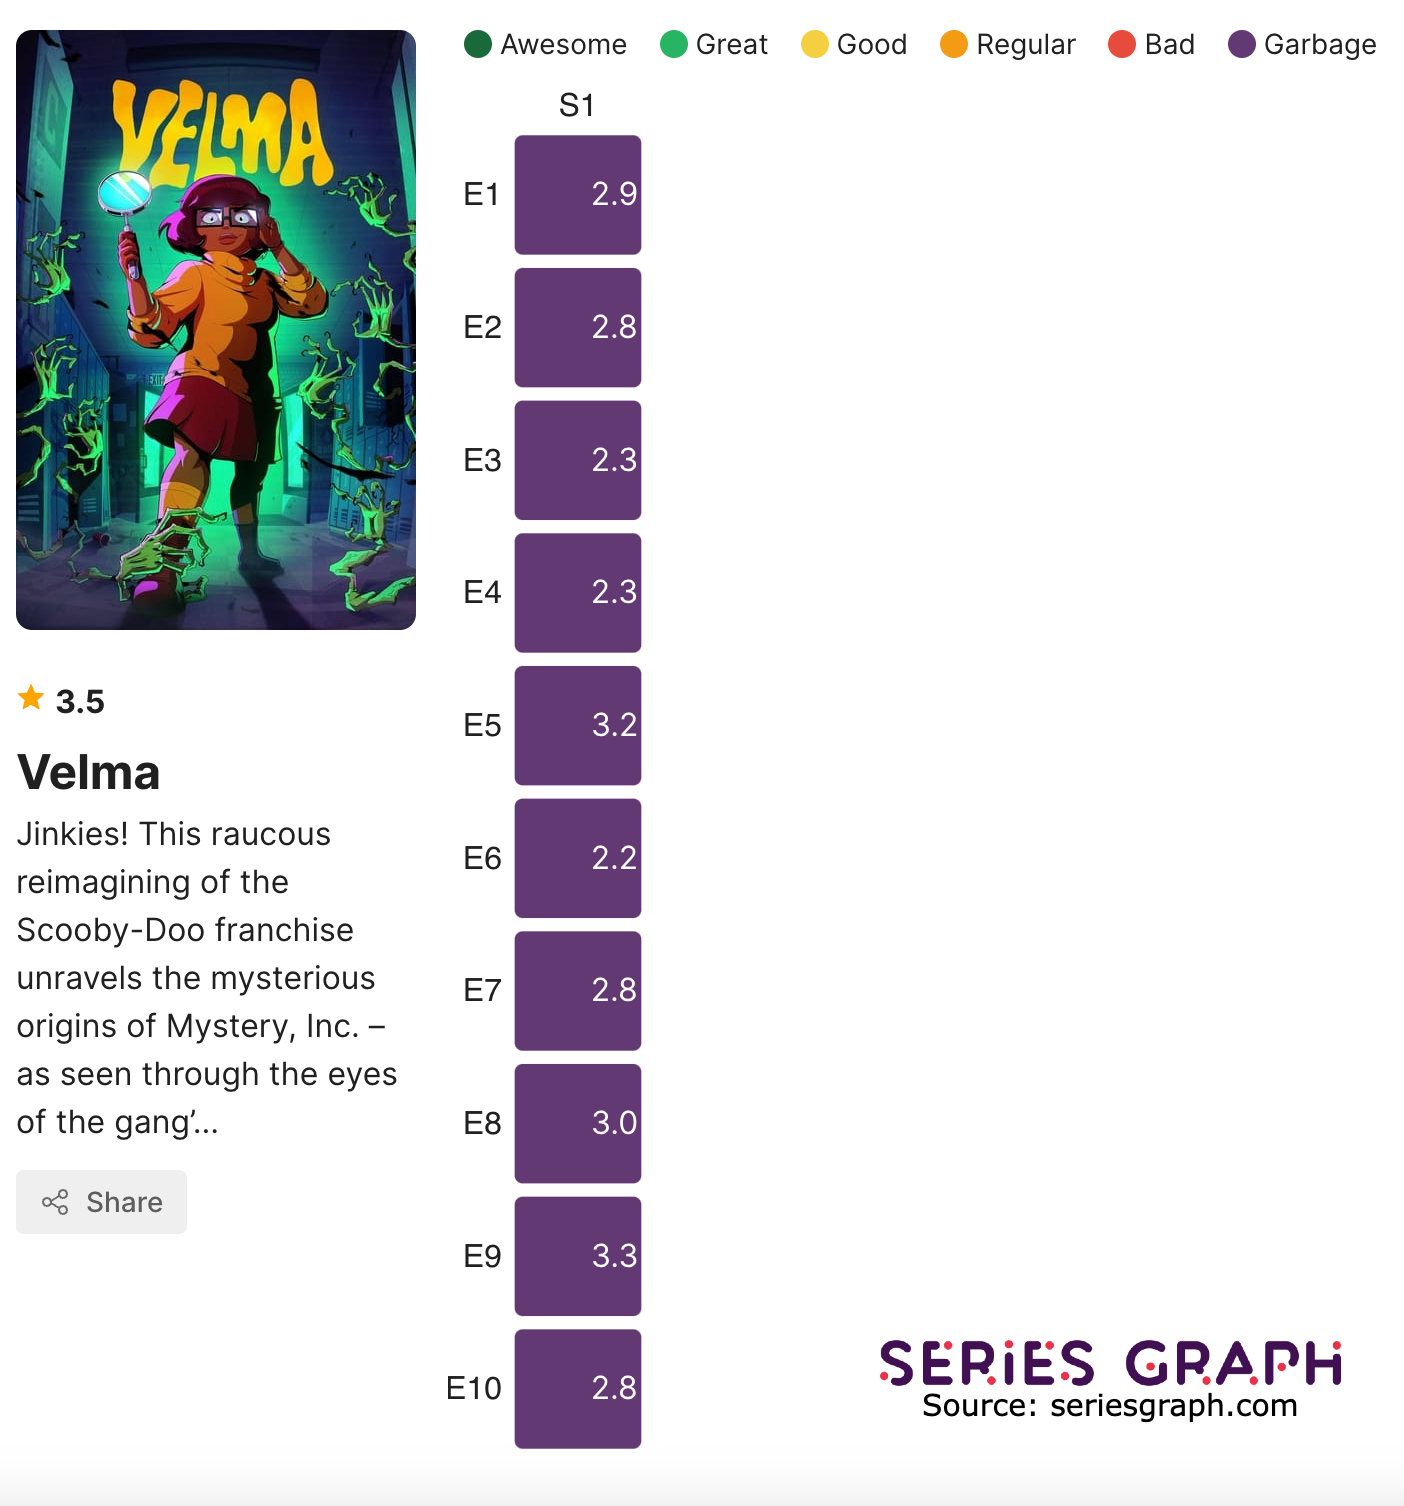
Advice [OC] Velma ratings by episode chart

Post image
0 Upvotes

r/dataisugly • • Jun 28 '22

Advice How can you create this visualization?

Post image
36 Upvotes