r/ethtrader • • Aug 06 '26

Analysis Ethereum is going to dominate everything - and no one sees it coming

254 Upvotes

I swear, I’ve been ordering nothing but pizza for the past 7 days, my family hates me because I’m ignoring everyone, and I smell like a pig. I’ve been in an absolute rabbit hole for the past week ever since the thought hit me: "Which cryptocurrency should I invest in?"

Of course, I stumbled across the usual suspects: Solana, Bitcoin, XRP, etc. But one in particular really caught my attention: Ethereum.
How is it possible that Ethereum is the second biggest cryptocurrency, but still feels so "cheap" and always falls to this lows?

So I started digging.
At first, I ended up on YouTube - like pretty much everyone. YouTubers doing all sorts of chart analysis. At first, it seemed plausible. But then I went back and watched some of their older videos, and guess what? Not a single one of their predictions came even remotely true.

Next, I moved on to crypto news YouTubers. But they all gave off this vibe of "How do I get the most views the fastest?" Some of it was informed, yes - but the promises were way too big and way too fast. Not for me. I don’t buy into that.
My motto has always been: Buy, hold, forget, celebrate in 1–3 years.

Naturally, I ended up in some forums. And the opinions on Ethereum couldn’t have been more divided. From “Ethereum is the best thing ever” to “Ethereum is so slow and trash.”
I think people are just frustrated because Ethereum is so volatile.

Up to this point, I guess most people have taken the same path.
And by now, 5 days had already passed.

After that, I made a post in a reddit thread.: "Why is ETH so undervalued?"
I expected maybe 3–4 replies.
Boom: Over 200 replies. And zero consensus.

That’s when I thought: Why not go straight to the root?

So I started watching tons of interviews with Vitalik from 2020–2025, tracked Ethereum’s development, watched BlackRock interviews, especially with Larry Fink, and looked into how Ethereum has changed over the years.

Ethereum was always cool, but it never focused on marketing. Only a tiny fraction of people even understand what ETH actually is.
But earlier this year, Ethereum launched something called Etherealize—which is aimed specifically at changing that, to finally start marketing Ethereum properly.

All of this, combined with BlackRock saying that everything will be built on ETH, and the fact that other companies also put ETH first, led me to this conclusion:

Ethereum is a caterpillar that’s turning into a GIGA MEGA ULTRA butterfly.

And here’s why I think that:

  1. Ethereum realized their public image sucks. They appointed two co-directors to strengthen leadership.
  2. Etherealize is actively reaching out to potential clients to pitch Ethereum.
  3. BlackRock is backing Ethereum, and in an interview, it was said that other companies also put ETH at the top.
  4. Last year, Larry Fink said in an interview that he wants to tokenize all of BlackRock’s assets because he’s convinced that’s the future.
  5. This year, Fink repeated in another interview that the SEC needs to hurry up because tokenization would simplify so much.
  6. Within just two months, BlackRock poured $2.2 billion into the BlackRock USD Institutional Digital Liquidity Fund. Before that, they had invested only $600 million over the course of an entire year.
  7. Ethereum still holds the largest market share—by far.
  8. BlackRock plans to tokenize its $150 billion Treasury Trust Fund. While they didn’t officially say it’ll be on ETH, the signs are obvious. In a recent interview at Etherealize, it was hinted that BlackRock did choose ETH. Also, they previously ran a very successful pilot project on Ethereum.
  9. Other companies are jumping on the ETH bandwagon too.
  10. Tom Lee just bought nearly 5% of ETH Supply in less than a year. And it is not his money, it is big institutional money

Okay… there’s a lot more I could say.
But those are my core fundamental data points for why I believe ETH is a sleeping giant.

What do you think?
If I’m missing something or misinterpreting any of this, feel free to call it out. I’m genuinely curious.
r/ethtrader • • 23d ago

Analysis Uptober is finally here

Post image
359 Upvotes

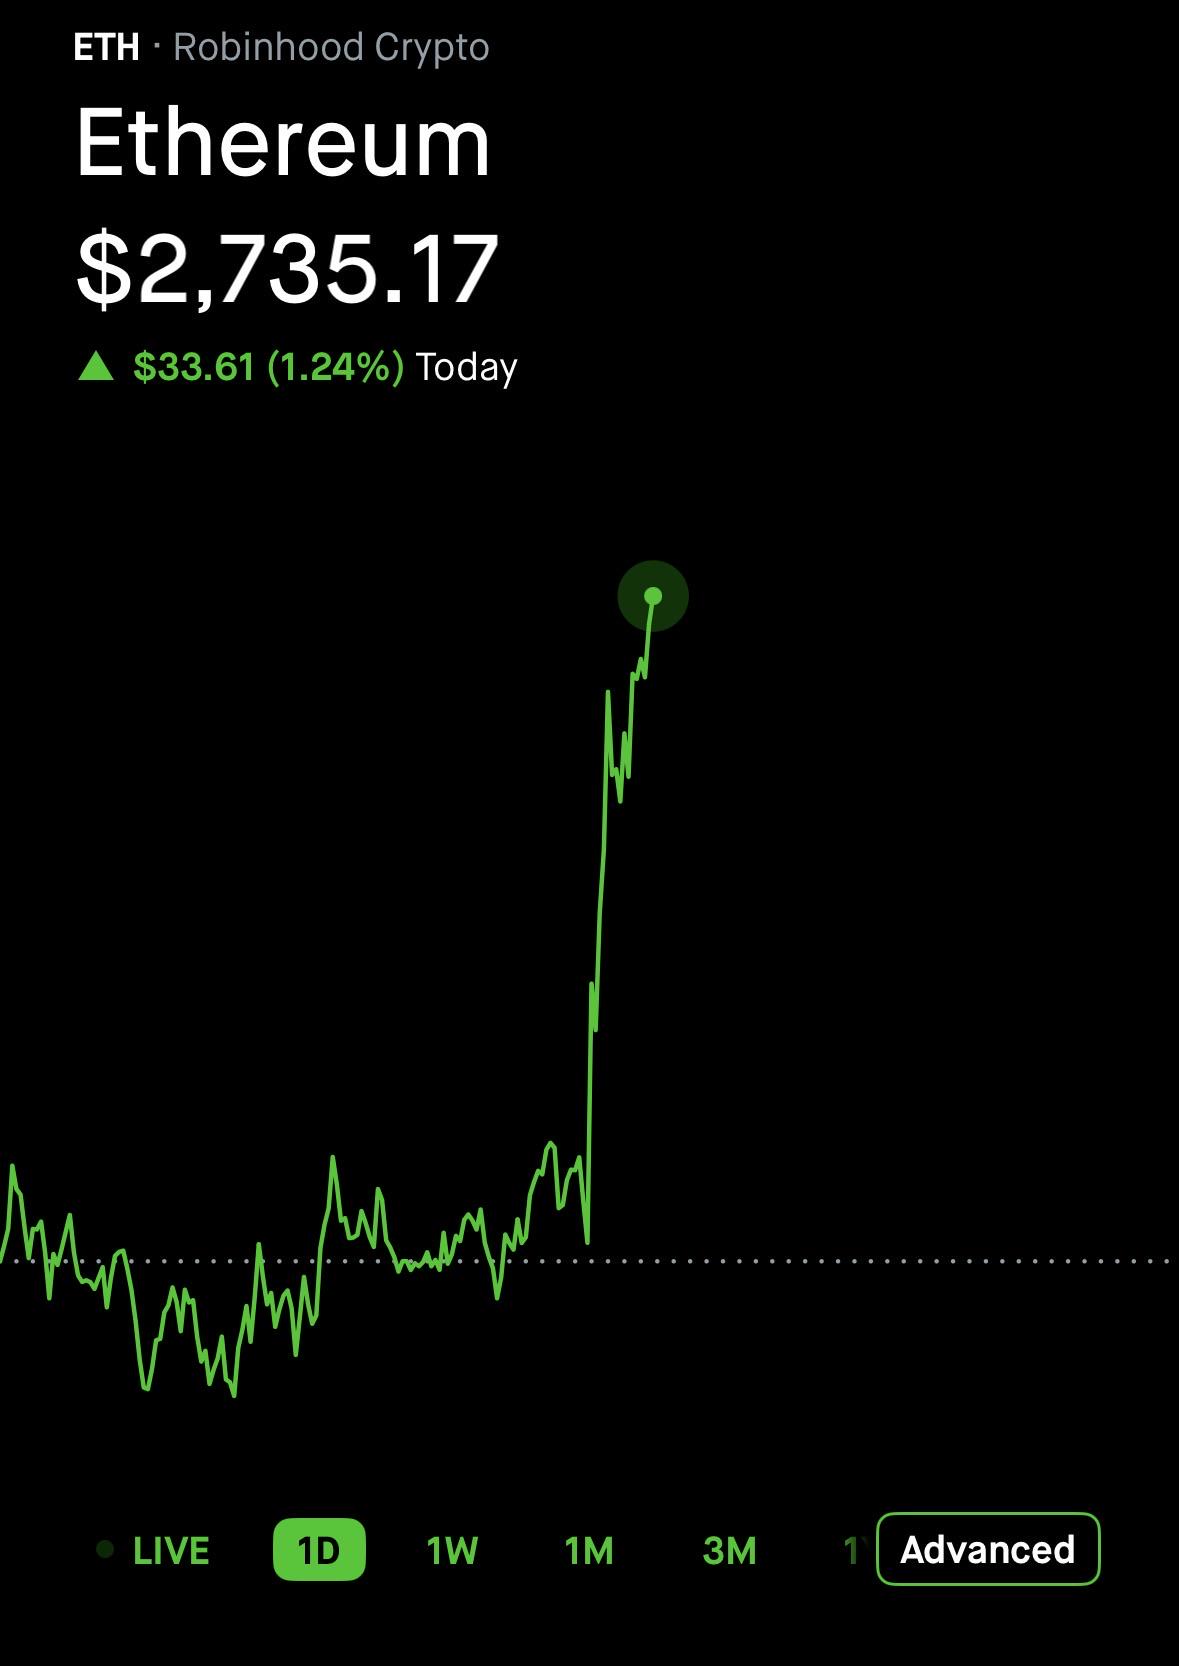
Get in everybody. We’re going higher. A lot higher!

r/ethtrader • • Jun 09 '26

Analysis Why is no one talking about arguably the most important aspect of ETH price action now

Post image
156 Upvotes

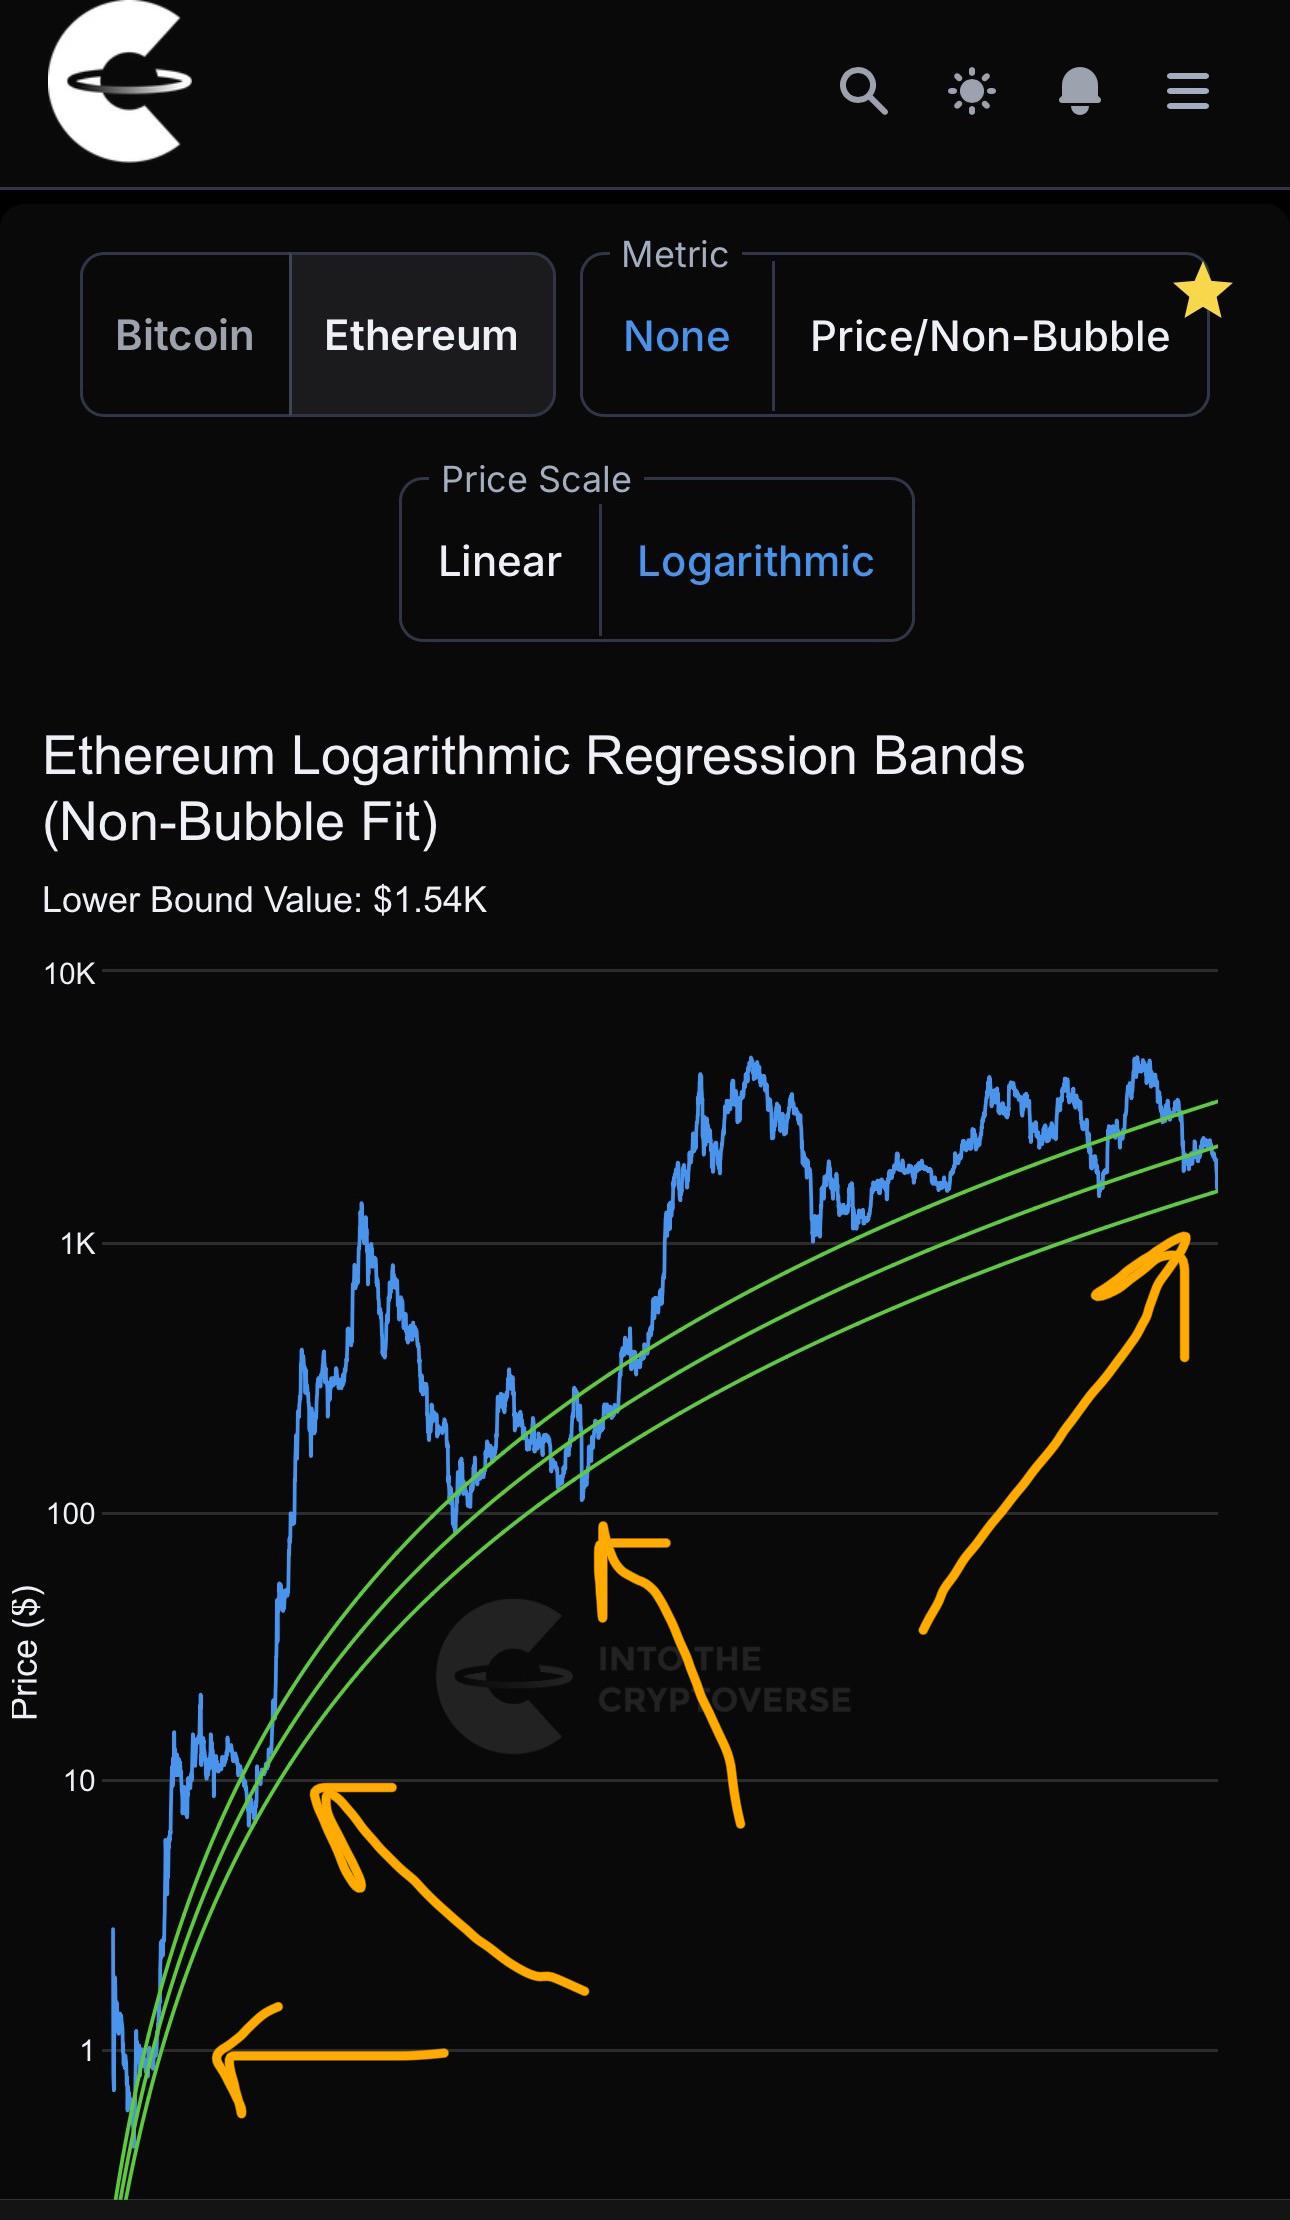
Its late here but before I sleep I would like to share what I think is one of the strongest indicators currently for ETH: its Logarithmic Regression Bands (screenshot courtesy of ITC).

If you’ve followed BTC and ETH for a long time like me then you surely know that the best DCA and accumulation times are when the assets are consolidating around the Lower Bounds of their regression bands. Price action does not spend a lot of time here because the last 3 times (4 with Covid) price was at the Lower Bound meant that Ethereum “went home”, grabbed a cold beer, made its backpack and set sail into serious bull runs.

ETH has spent the last 6+ years away from this level, sometimes getting close, sometimes being far away but its date with destiny is now.

I’m not claiming I know something for sure and this is not financial advice (especially when I’m half asleep trying to articulate this post) but I’m not joking, I’ve been waiting for this moment for the past 5 years since ETH’s last euphoric top. And this moment is exactly when the majority of traders get blind sided, panic and take bad decisions.

TLDR: Ethereum has tagged its Logarithmic Regression Lower Band (1.54K) in the past 48 hours, 5th time ever. The last 4 times marked bottoms and serious bullish price action followed in the coming months. Good night, DYOR!

r/ethtrader • • Sep 19 '26

Analysis Fucking it still. So you know haha

Post image
248 Upvotes

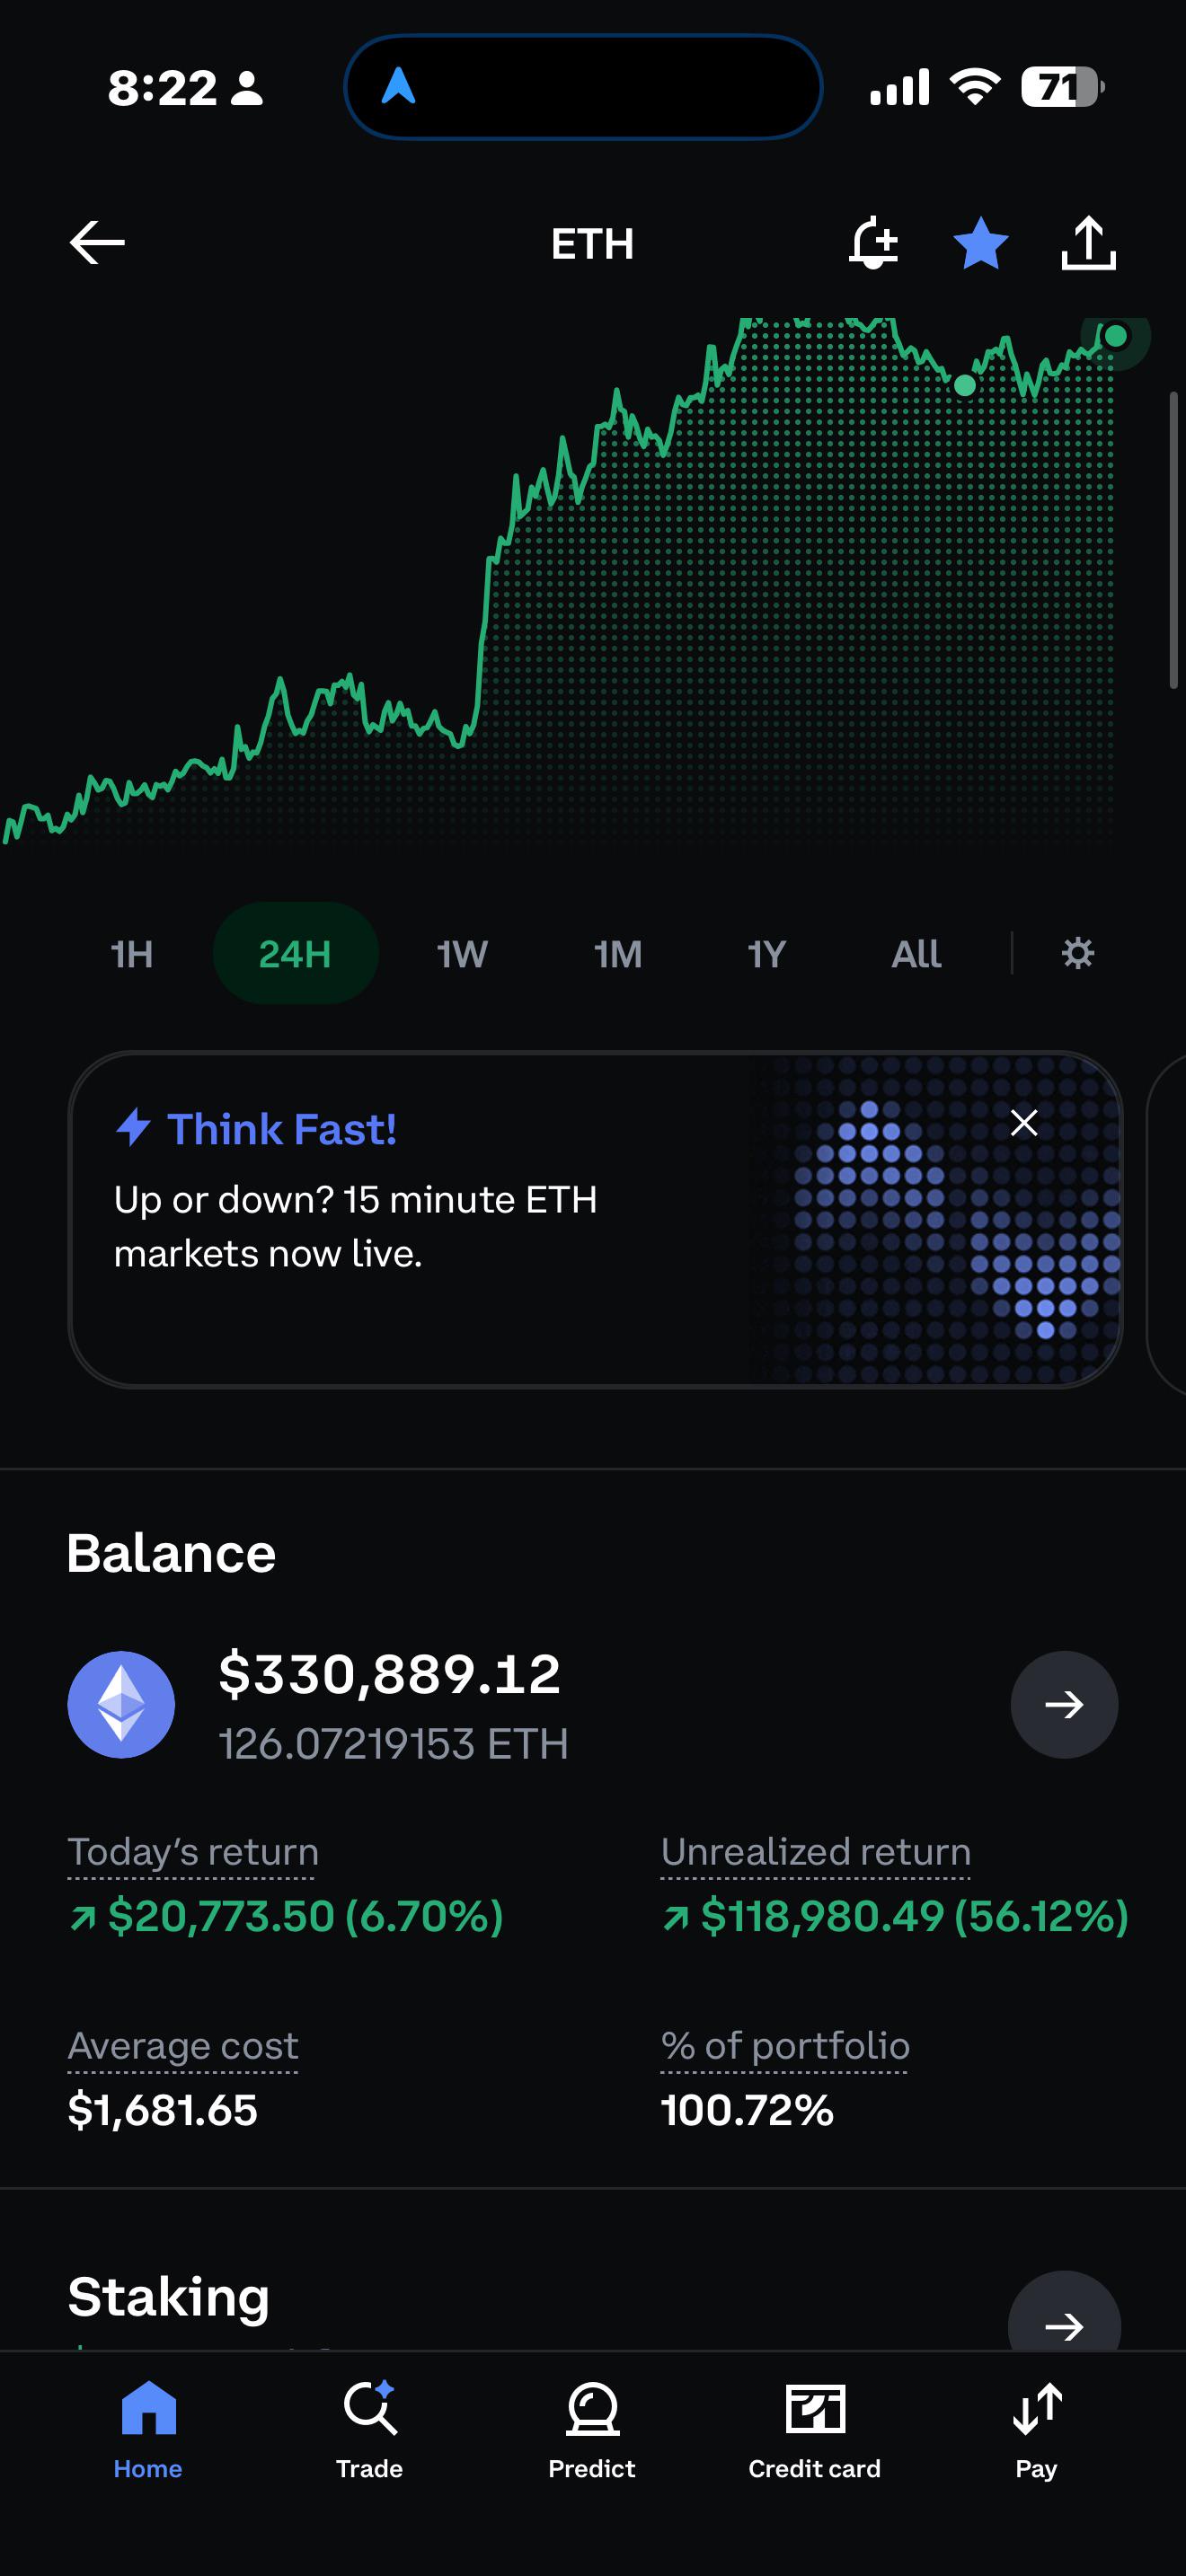
So after calling the Wycoff Accumulation in June. I did go heavy with adding 50 ETH. We are at the SOS phase. Close above 2560 on the daily and 3 day chart would be the confirmation of start of the bull market and also prove 1505 was the bottom and spring for wycoff accumulation phase

r/ethtrader • • Sep 04 '25

Analysis The case for ETH going to $12k.. or even $62k.

264 Upvotes

Tom Lee (from Fundstrat) thinks there is a big chance ETH could hit $62k. Milk Road's Twitter account did an analysis to verify the possibility of this prediction happening. If Bitcoin climbs to $250k then ETH's value depends on its ratio to BTC. Over the last 8 years that ratio was on average 0.048. At that ratio level ETH is worth around $12k (if BTC goes to $250k). If it goes back to the 2021 high of 0.087, we get $22k.

Tom Lee says that is not all. Ethereum is turning into the backbone of finance, like the foundation for payments and banking. If it replaces old systems the ratio pumps to 0.25, pushing ETH all the way up to $62k. How does that sound? I like this idea xD. Right now Ethereum leads in DeFi with about 60% of the locked value, over $153 billion this year. Sure, there are still competitors like Ripple or Solana, Cardano.. but look at Ethereum's growth.

One might wonder if this is too optimistic. First Bitcoin needs to rally and the market changes fast. Still if Ethereum keeps building, this target is not impossible if you really think about it. If you believe this is possible it could change how you invest.

Source: https://x.com/MilkRoadDaily/status/1963001300951695419

r/ethtrader • • May 31 '26

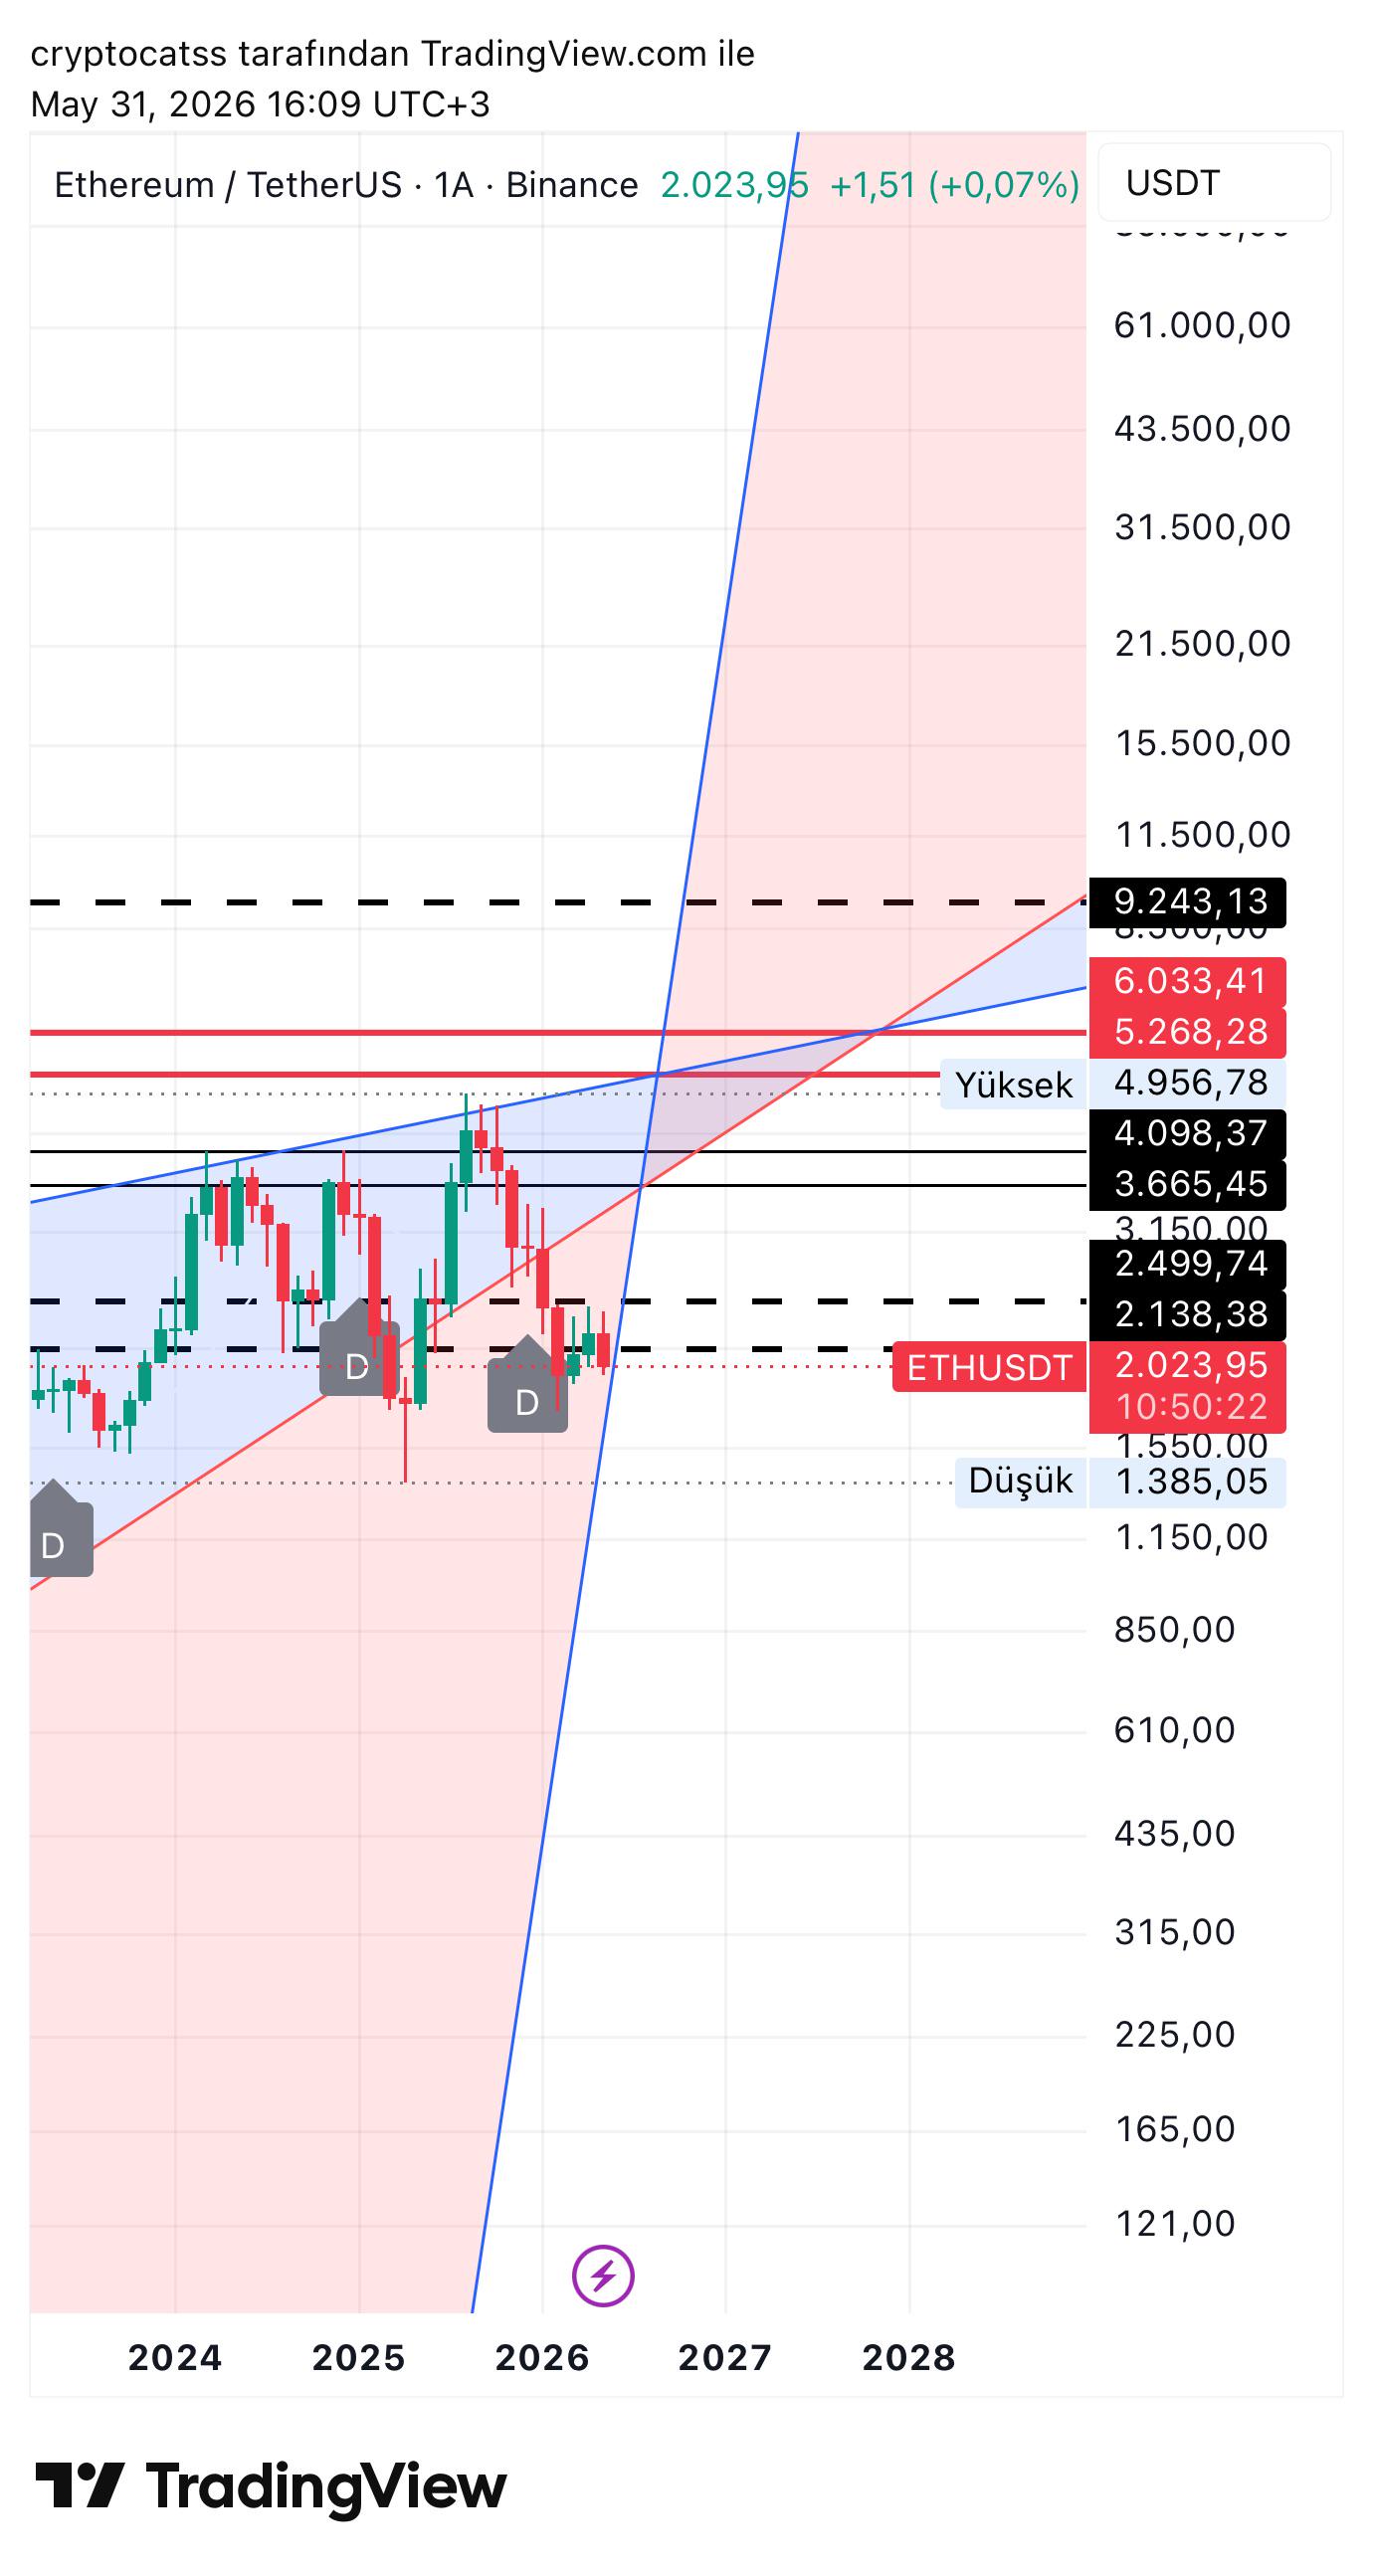
Analysis ETH is down ~30% in 2026 with $400M in ETF outflows. Is this still “Ethereum’s year”?

Post image
83 Upvotes

Genuine question, because I keep flip-flopping on this one.

Coming into 2026 the narrative was loud: Glamsterdam, tokenization, JPMorgan launching JLTXX on Ethereum, ETF inflows. The whole “ETH is finally the year” thesis. Five months in and ETH is sitting around $2,024, down more than 30% year to date , and trading below the average cost basis of basically every major holder cohort.

The bear data:

• US spot ETH ETFs bled $401M net in May, the third worst month since late 2025 

• Estimated ETF cohort cost basis sits around $3,500, so the institutional money that came in is deep underwater , roughly 40%

• June is historically ETH’s weakest month, average return -6.7% since 2016 

The bull data that won’t die:

• Whales excluding exchanges added over $2B of ETH in May even as price fell 

• BitMine crossed the 5M ETH threshold 

• On the monthly chart ETH is still holding the multi year rising log channel support and hasn’t broken structure

So the setup is genuinely split. Supply is quietly moving from weak hands to strong hands, but there is no demand trigger and ETF money is leaving, not arriving.

My honest read: the structure isn’t broken, but the “Ethereum’s year” call needs price to actually reclaim 2,138 then 2,499 to mean anything. Until then it’s a thesis without confirmation. Lose the rising support and 1,385 is back on the table.

Curious what this sub thinks. Accumulation phase before an H2 move, or are we just providing exit liquidity to everyone who bought the narrative?

r/ethtrader • • Jan 28 '25

Analysis [ Removed by Reddit ]

291 Upvotes

[ Removed by Reddit on account of violating the content policy. ]

r/ethtrader • • 2d ago

Analysis Bitcoin Will Never Exceed its ATH by More than 10%, Bitcoin's Bottom Will Be Below 40K, and Ethereum's Price will be greater than 16K USD within 10 Years.

50 Upvotes

Bitcoin is, first and foremost, a secure space to make financial relationships with other people. This video clip, is, in my opinion, the best expression of what blockchain and by extension, bitcoin really is. Although Lei Yang doesn't mention relationships, most of the code is about finance and financial relationships, and it gets across the point, which is that, at its core, cryptocurrency is about security. It's about providing a way to enforce relationships in a world where we cannot rely on governments or corporations to provide fair enforcement.

Bitcoin's security is provided by the miner reward, in the form of new Bitcoin. If the miner reward didn't exist, or more importantly, got low enough, attackers would be able to arbitrarily rewrite the ledger of Bitcoin transactions, by gaining control of the computing power used to validate blocks of transactions. Such an attack recently happened to Monero.

Bitcoin's predictable miner reward schedule also produces the bubbles which follow after a halving. Every time there is a cut in new Bitcoin supply, the reduction in new supply increases the price. However, each reduction in new supply is smaller relative to the amount of already existing supply in circulation. This creates an important collorary. It follows directly from halving theory that each bubble after the halving will me smaller on a relative basis than the previous bubble. From this observation, we can make long term predictions about Bitcoin's long term price.


Order of magnitude is a concept often found in science, where exponential functions are common. One order of magnitude is one zero behind a number, so 100 two orders of magnitude greater than 1. Each percentage increase in gains from the ATH of each halving bubble, is one order of magnitude less each cycle.

https://www.tradingview.com/x/DCWm7BWb/

Approximately speaking, whereas the first to second bubble was a x0,000% gain, the second to third was a x000% gain, the third to fourth was a x00% gain, and the fourth to fifth, was an x0% gain. It follows that the 5th to 6th bubble will be an x% gain.

This trend is even more apparent if we use the log scale fibbonacci levels to compare bitcoin cycles relative to the preceding cycle. Note, I do not actually believe fibbonacci levels have any special meaning. The important part is that they are relatively evenly spaced lines mapped onto a log scale chart. Any chart with log scale spacing should be able to show the same pattern.

Halving 1: https://www.tradingview.com/x/qJrWovpu/

Halving 2: https://www.tradingview.com/x/NO2JY7FZ/

Halving 3: https://www.tradingview.com/x/XvXogCuQ/

Halving 4: https://www.tradingview.com/x/Jl0RbEZe/

So what we can see from these halving charts is that bitcoin hits a lower rung each time on the log scale fibbonacci chart. So based on the trend, bitcoin will no longer see substantial gains from halving bubbles anymore.


Now, here's a trick. We can use the same logic and methodology to determine where the bottom of the next bitcoin cycle will be.

Each halving creates a permanent reduction in new bitcoin supply. This creates a new price floor, which increases each halving. But the rate it increases each halving should also decrease, because each permanent reduction is smaller relative to total existing supply.

So to determine where the bottom of the next bitcoin cycle will be based on the physical supply trend created by the halving, all we have to do is invert the chart, and use the log scale fibbonaccie, treating the bottoms as tops and tops as bottoms.

https://www.tradingview.com/x/itw63qRh/

https://www.tradingview.com/x/vb2fnlFV/

https://www.tradingview.com/x/1CSV8t5q/

https://www.tradingview.com/x/QoRTGxry/

As you can see from the above charts, Bitcoin hits a higher and higher rung on the fibbonacci ladder each cycle. And the next highest run is 34K. So it follows that the bottom of the next cycle should be somewhere between 35-40K.


Finally, the fact that bitcoin no longer increases each halving cycle suggests that bitcoin's will start to fail, on a protocol level, relatively soon. The block reward exists to prevent malicious entities from rewriting bitcoin's block history. If bitcoin's history could be rewritten, no one would use it. However, people clearly value a digital currency that isn't controlled by any single corporation or government. Bitcoin clearly shows that the asset class has value.

This suggests that at some point in the future, there will be an enormous financial opportunity. Bitcoin will be supplanted by another cryptocurrency meaning investors today have the opportunity to literally invest in the next Bitcoin, and get Bitcoin level gains.

I believe that Ethereum will be the cryptocurrency that will take Bitcoin's place in the global economy. Ethereum is the most secure, cryptocurrency outside of Bitcoin. It has enormous adoption from all sorts of entities and people around the world. It also has the most number of developers working on it, which is essential in this era of AI hacking and quantum computing.

It follows that as halvings reduce the mining supply which keeps Bitcoin secure, Ethereum will gain prominence. Because halvings no longer produce long term gains in bitcoin's price, this should start to happen within the next 2-3 halving cycles (hence, 10 years). Bitcoin attained a two trillion dollar market cap, and if Ethereum attains that market cap, that is 16K per Ethereum. I think Ethereum goes well beyond that price in the long term.

r/ethtrader • • Aug 21 '26

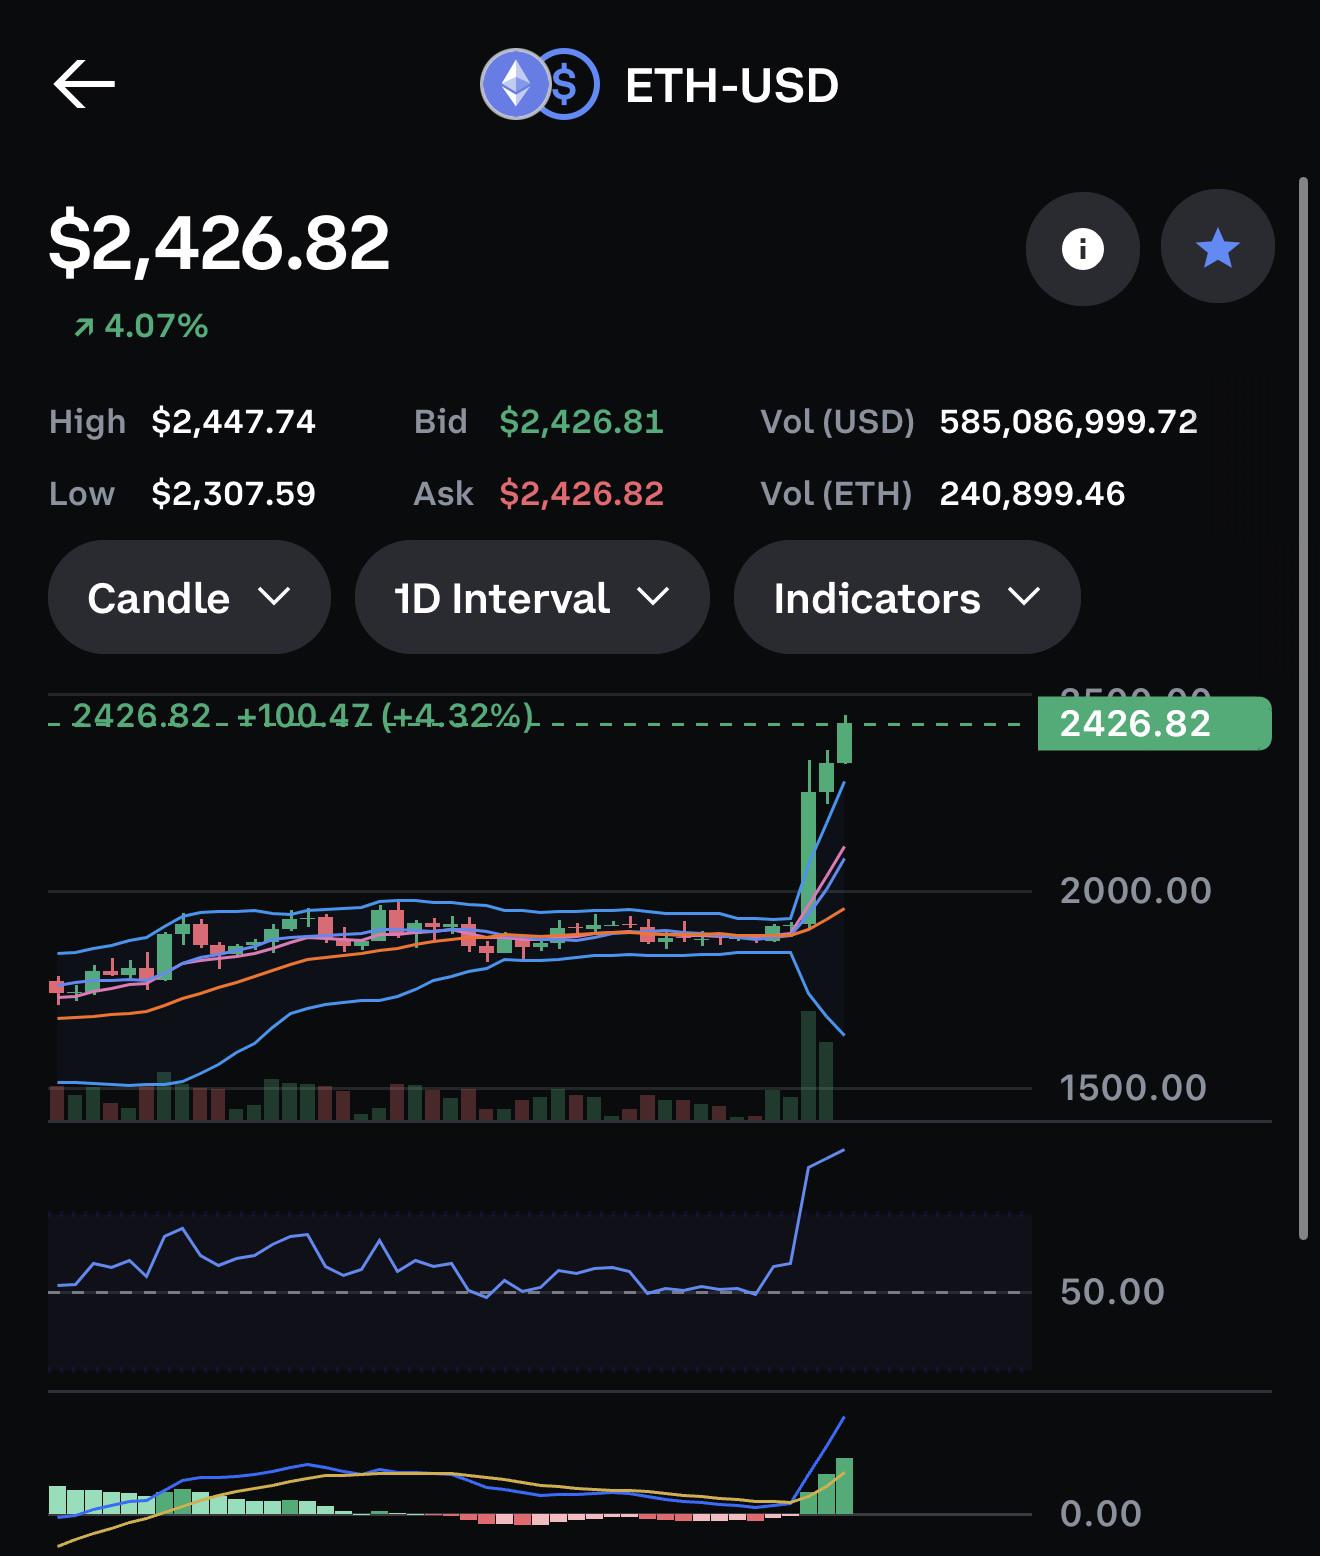
Analysis ETH’s Bullish Trend Reversal Is Becoming Hard to Ignore

Post image
115 Upvotes

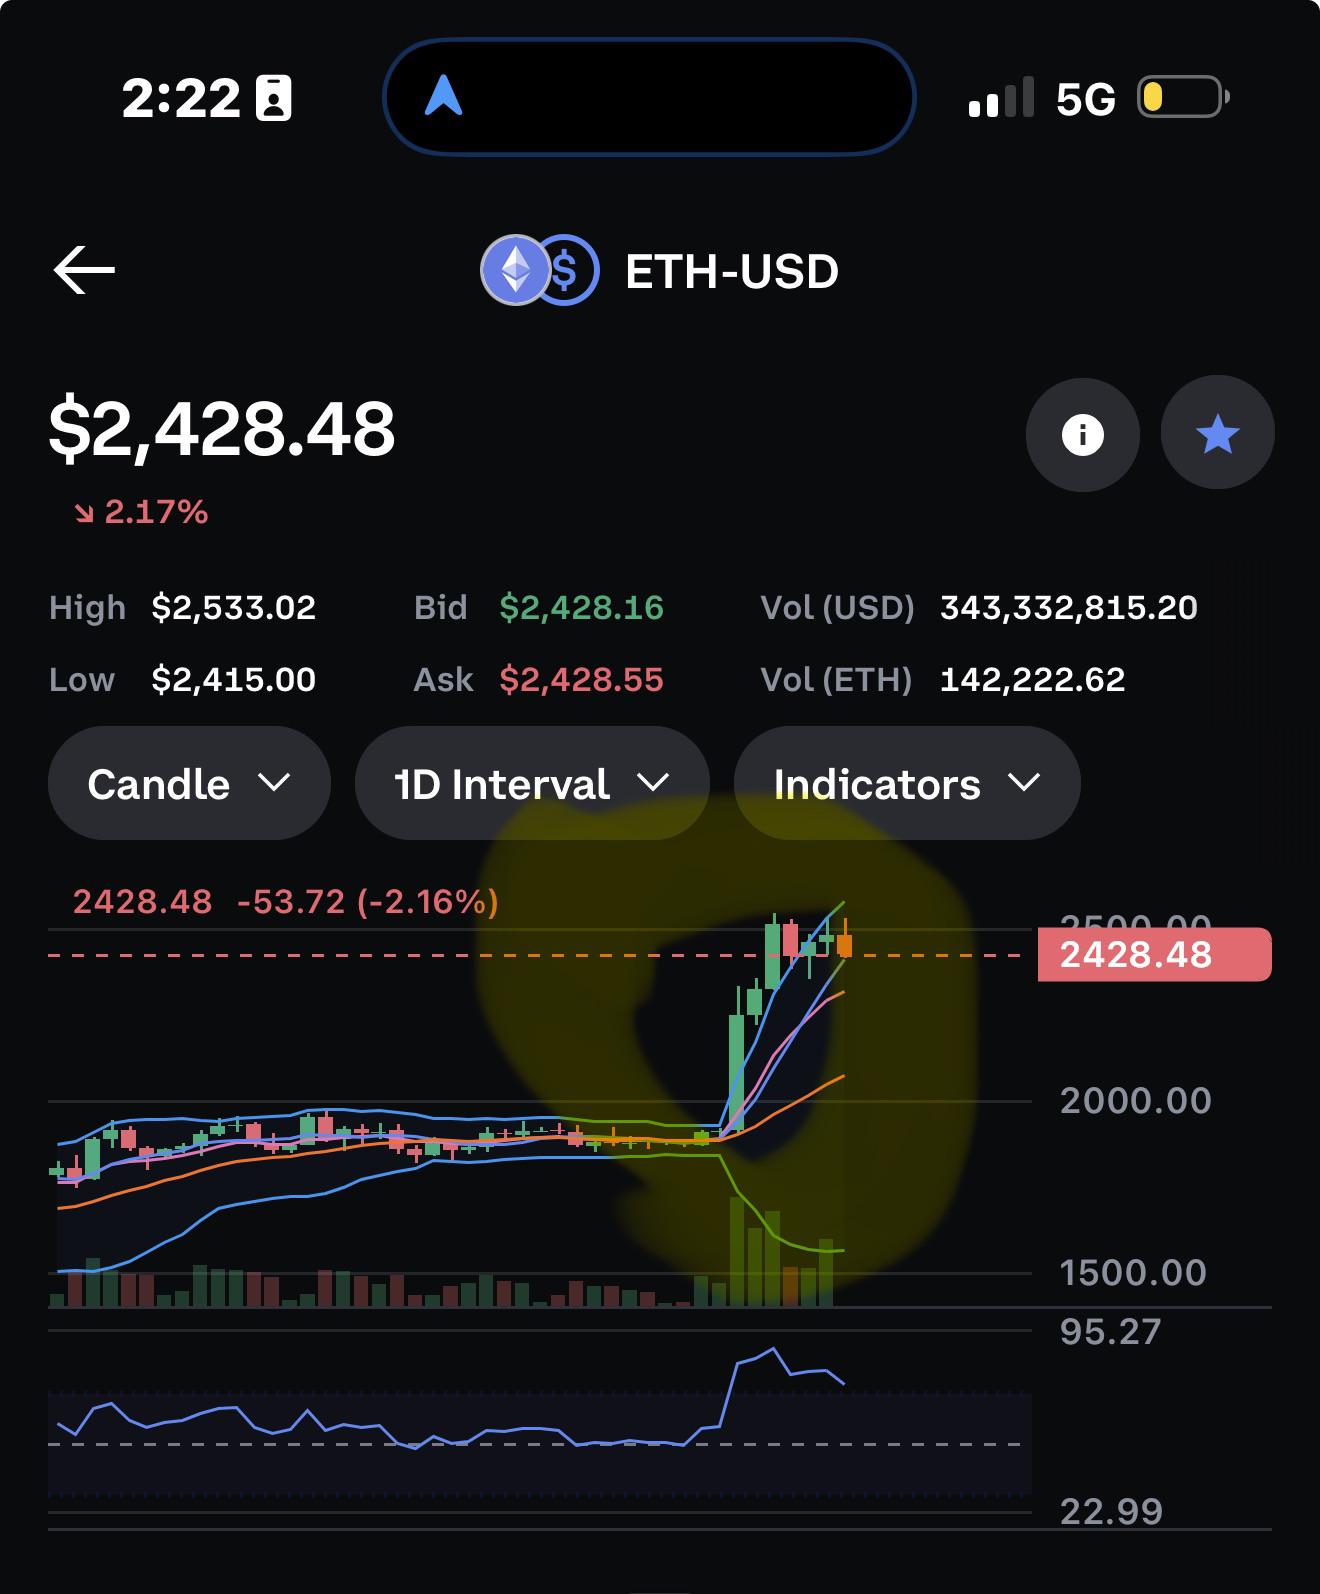
This daily chart is one of the strongest signs yet that ETH’s trend has reversed.

After months of consolidation, ETH broke out with a major expansion in trading volume—the kind of participation you want to see when confirming a genuine move rather than another short-lived bounce. Price has pushed decisively above the previous range and reclaimed the critical $2,000 area.

The MACD strengthens the case: a sharp bullish crossover, rapidly expanding green histogram bars, and accelerating momentum above the zero line. This isn’t a weak crossover—it’s a significant momentum shift accompanied by real volume.

The combination is what makes this convincing:

Explosive breakout from a long consolidation
Major increase in buying volume
Strong bullish MACD crossover
Expanding positive momentum
Multiple daily candles holding above $2,000
ETH may be temporarily overbought and could retest the breakout zone, but that wouldn’t invalidate the reversal. If the $2,000–$2,200 region turns into support, the evidence increasingly points to the beginning of a new bullish trend—not just a relief rally.
The next major confirmation would be reclaiming the 200-week moving average and establishing support above it. 2500 level to watch and turn to support

r/ethtrader • • 27d ago

Analysis Ethereum is far and away the most decentralized ledger. Its real node count is 10,000 to 20,000

119 Upvotes

Ethereum's validator count, about 881,000 today (InsideCrypto), is sometimes presented as a count of the machines running the network, but that framing is inaccurate.

Each validator is a staked identity with its own keys, and it runs as software on a node. A single node can run thousands of them.

A node is a computer running Ethereum's client software. It checks every new block against the protocol's rules on its own.

My estimate is that Ethereum's real node count is 10,000 to 20,000. Etherscan's node tracker found 11,726 nodes on Oct 1 (Etherscan node tracker). It can only count the nodes it's able to reach, so the real number is higher.

Even at that smaller number, Ethereum is far and away the most decentralized ledger in the world. Its nodes run six separately built execution clients and six consensus clients, so a bug in one of them doesn't affect every node. Ordinary people can run one of those nodes at home. The ethereum.org site links a guide that shows you can turn even a Raspberry Pi 4 into a full Ethereum node.

r/ethtrader • • Aug 05 '26

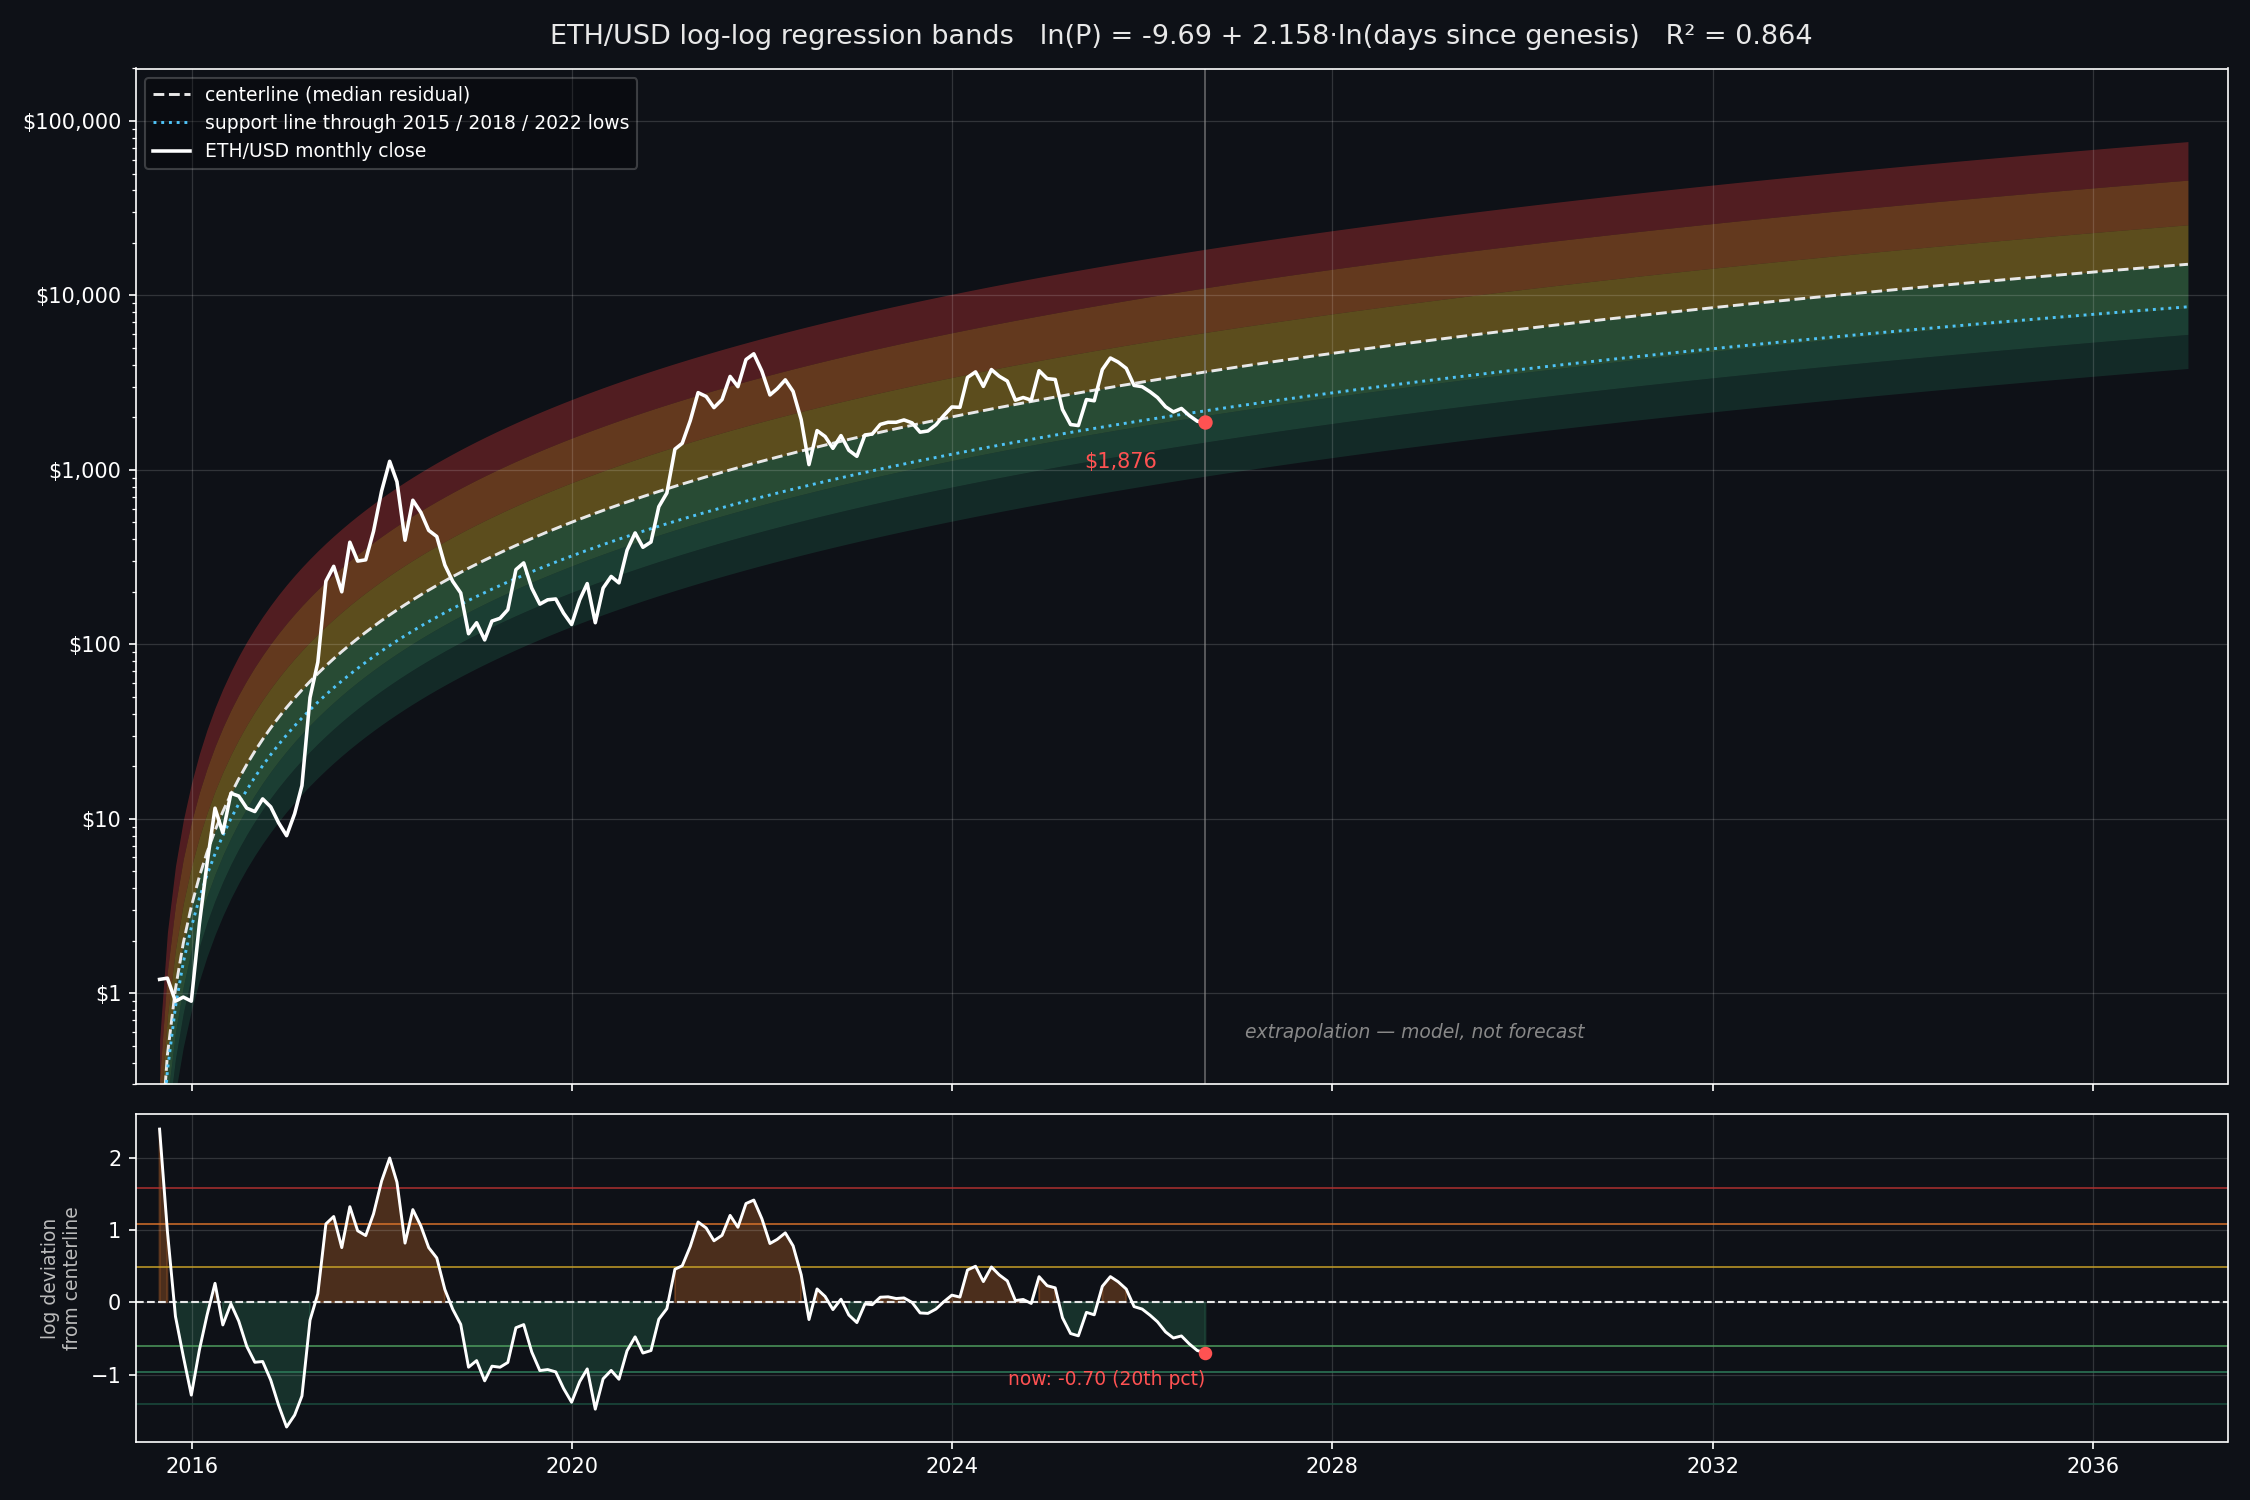
Analysis Eth log regression bands to 2036

Post image
83 Upvotes

here to share some eth log regression bands that extrapolate to 2036

*edit*: i didnt know log regression band fitting can be so controversial. calm down guys it is just some maths on historical price action.

also this is only a math model and not a crystal ball and shouldnt be treated as your only data point :)

r/ethtrader • • Aug 11 '25

Analysis [ Removed by Reddit ]

279 Upvotes

[ Removed by Reddit on account of violating the content policy. ]

r/ethtrader • • Jun 13 '26

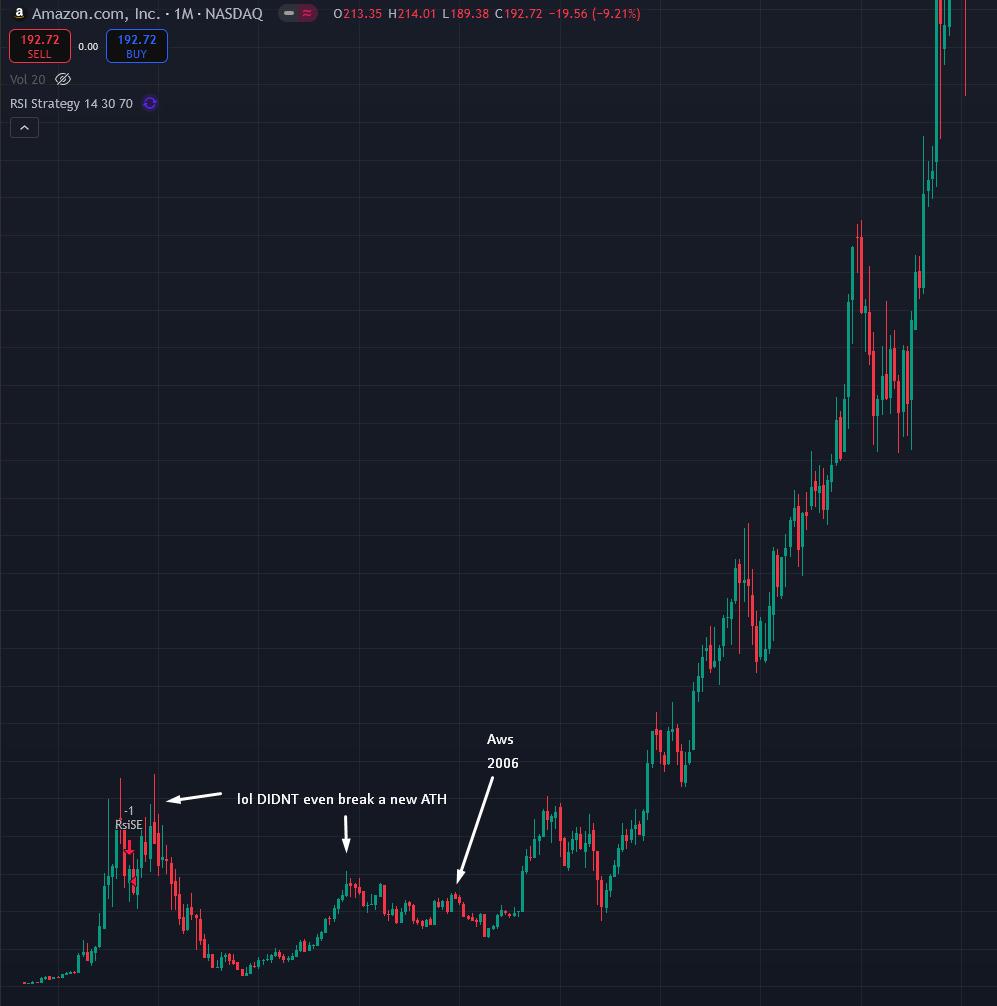
Analysis Comparing ETH to Amazon

Post image
99 Upvotes

r/ethtrader • • Feb 19 '25

Analysis Ethereum Has 'Died' 126 Times So Far - But Is ETH Really Dead?

207 Upvotes

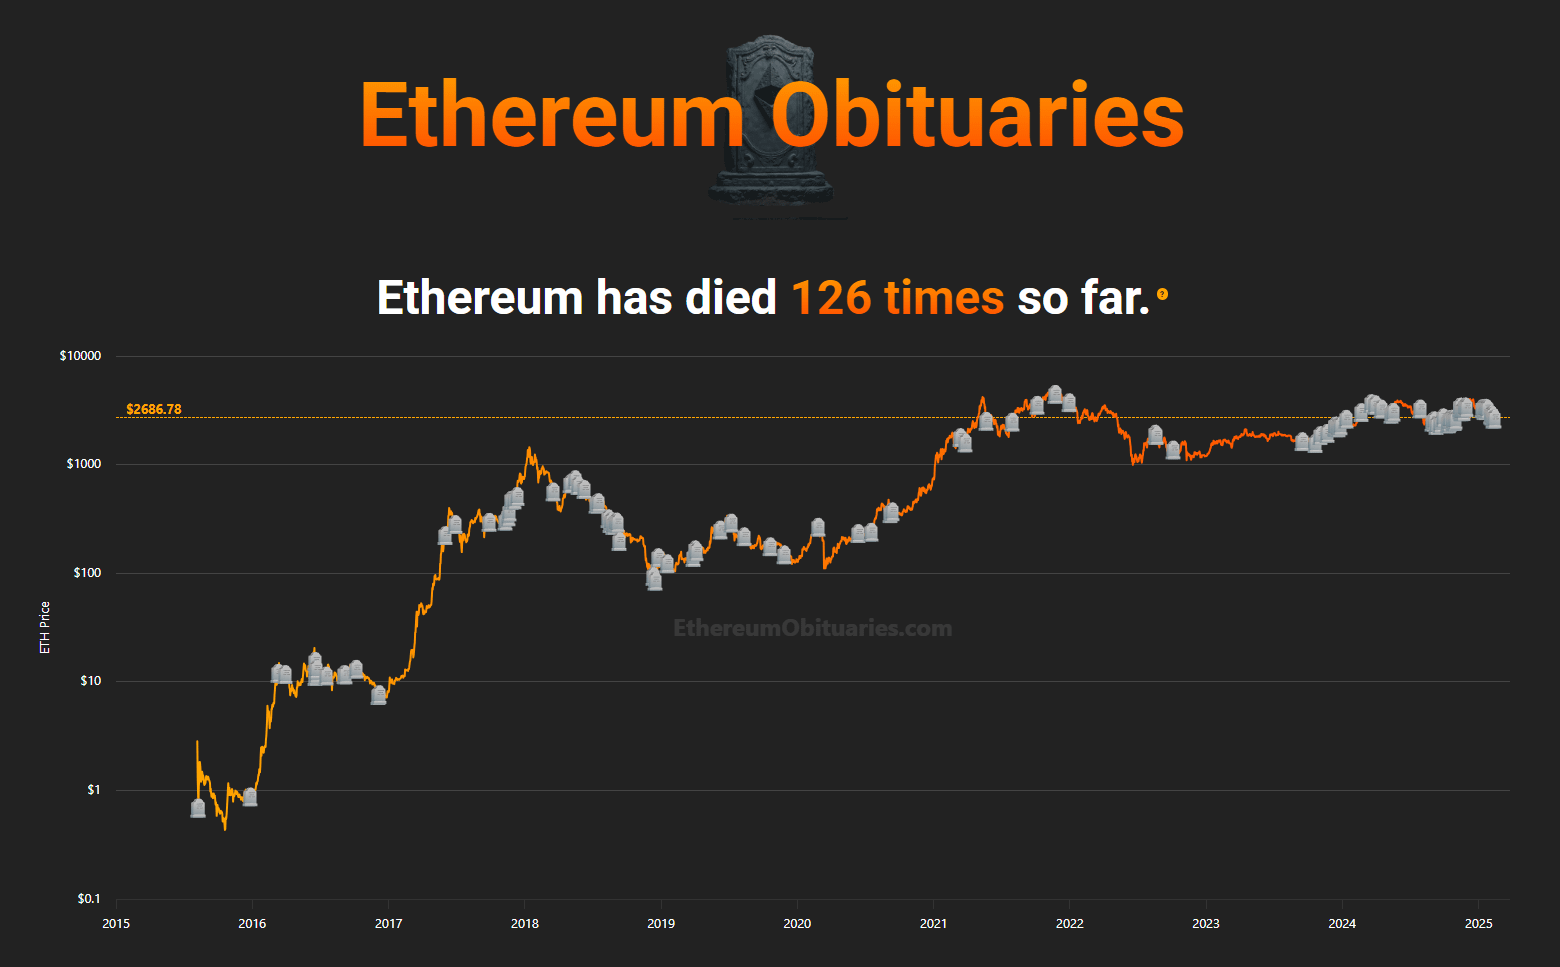
Just crossed with this Tweet talking about Ethereum dying 61 times in the last 3 years and it made me wonder. Is there any kind of Ethereum Obituaries site like the one for Bitcoin Obituaries? And yes, I found one Ethereum Obituaries site that shows how many times Ethereum has died according to media articles and some Twitter influencers.

Ethereum Obituaries

As you can see in the chart above, it looks like a BTC maxi decided to develop this because of the orange color, kidding, no idea why that color but I would have used a blue or more Ethereum related color.

As you can also see Ethereum has died 126 times so far and looks like every time it has returned from death. To put some perspective comparing with Bitcoin, Bitcoin has died 415 times. And you can also notice, ETH is dead narrative is getting strength in the last 2 years. I guess that is because some people and business in the competence are scared that Ethereum will conquer the whole ecosystem.

With all this post I just want to show in a "fun" way that no matter what people, media or big boys say, Ethereum has keep building and developing non stop. This is why we always have to check metrics, developments, adoption of Ethereum and also the projects on top of it like L2s because all that information will show us the path to HODL without hesitating and not just looking to a number (price) that only shows how manipulated the market is. Ethereum ecosystem time will come soon and its just a matter of when.

Timeline

This site also shows the timeline of all the events that are represented on the chart just in case someone want to check each one of them.

Sources:

r/ethtrader • • 12d ago

Analysis ETH Bullish Divergence

Post image
65 Upvotes

Ethereum bounced very strongly after forming a Bullish Divergence.

more upside coming ?

r/ethtrader • • Oct 13 '25

Analysis Ethereum passed the market crash stress test and that is a big deal.

232 Upvotes

The crash last week did not just affect prices. As a matter of fact it tested the fundamentals of every single blockchain.. and guess what, Ethereum came out stronger. When everything turned red and everyone was panicking to sell network usage exploded. Fees skyrocketed even on Layer 2's because traders rushed to transfer their coins and also manage liquidations.

In the middle of all that chaos Ethereum was steady and held firm!! Let's go through some numbers:

  • Ethereum handled almost 3k transactions per second with a failure rate below 1%. This kind of stability under conditions of extreme stress is very rare in crypto.
  • In the past week alone more than 3.4k coins were burned. You can see how much demand the network had.

Some haters were complaining about high fees again, yes high usage = high fees but also that means Ethereum is the go-to when things get serious. This crash was not merely a stress test but also proof of resilience. Ethereum did not bend under pressure, it processed billions of volume without breaking.. something the majority of its competitors cannot say. That matters to institutions that are watching from the outside, Ethereum just proved that it is ready for them. Reliability is what turns technology into infrastructure!!

Resources:

r/ethtrader • • 16d ago

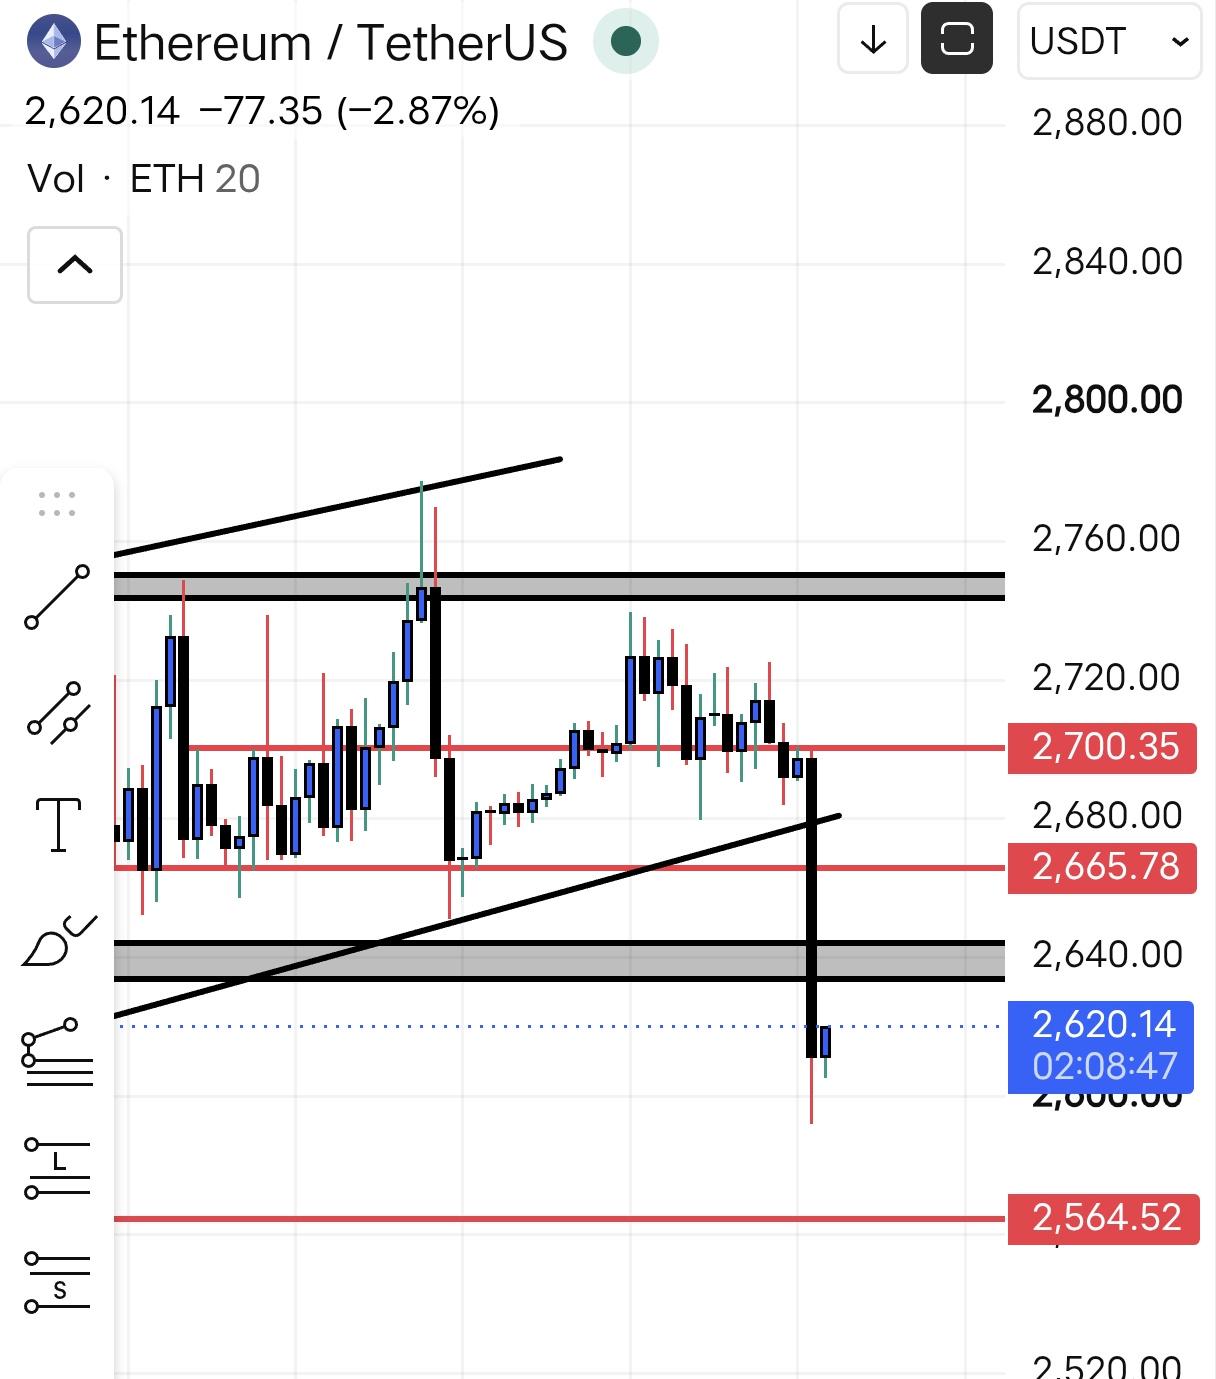
Analysis ETH got rejected at the top of the 2350-2570 range. Data says no fresh money behind the bounce

42 Upvotes

ETH is sitting in a key zone for me, between 2350 and 2570. A clean break on either side should kick off a proper move.

What I'm seeing right now: price poked above 2570 on the 4h and got rejected straight back down. The derivatives data kind of explains why. Price is up 1.4% on the day but OI actually dropped 1%, and shorts got liquidated about 3x more than longs ($42M vs $12.7M). So this bounce looks like shorts closing, not new buyers coming in. Meanwhile around 70% of accounts are long (L/S 2.37) and funding is slightly positive.

My read: without OI starting to rise, I don't see the strength to break 2570. A pullback toward the middle of the range looks more likely first.

Levels I'm watching:

- Lose 2350 and I'd expect the next support around 2000-2100

- Hold it and break above 2570 with rising OI, and I'm looking for a retest of 2800

What levels are you guys watching?

r/ethtrader • • 13d ago

Analysis Official bullish divergence

Post image
41 Upvotes

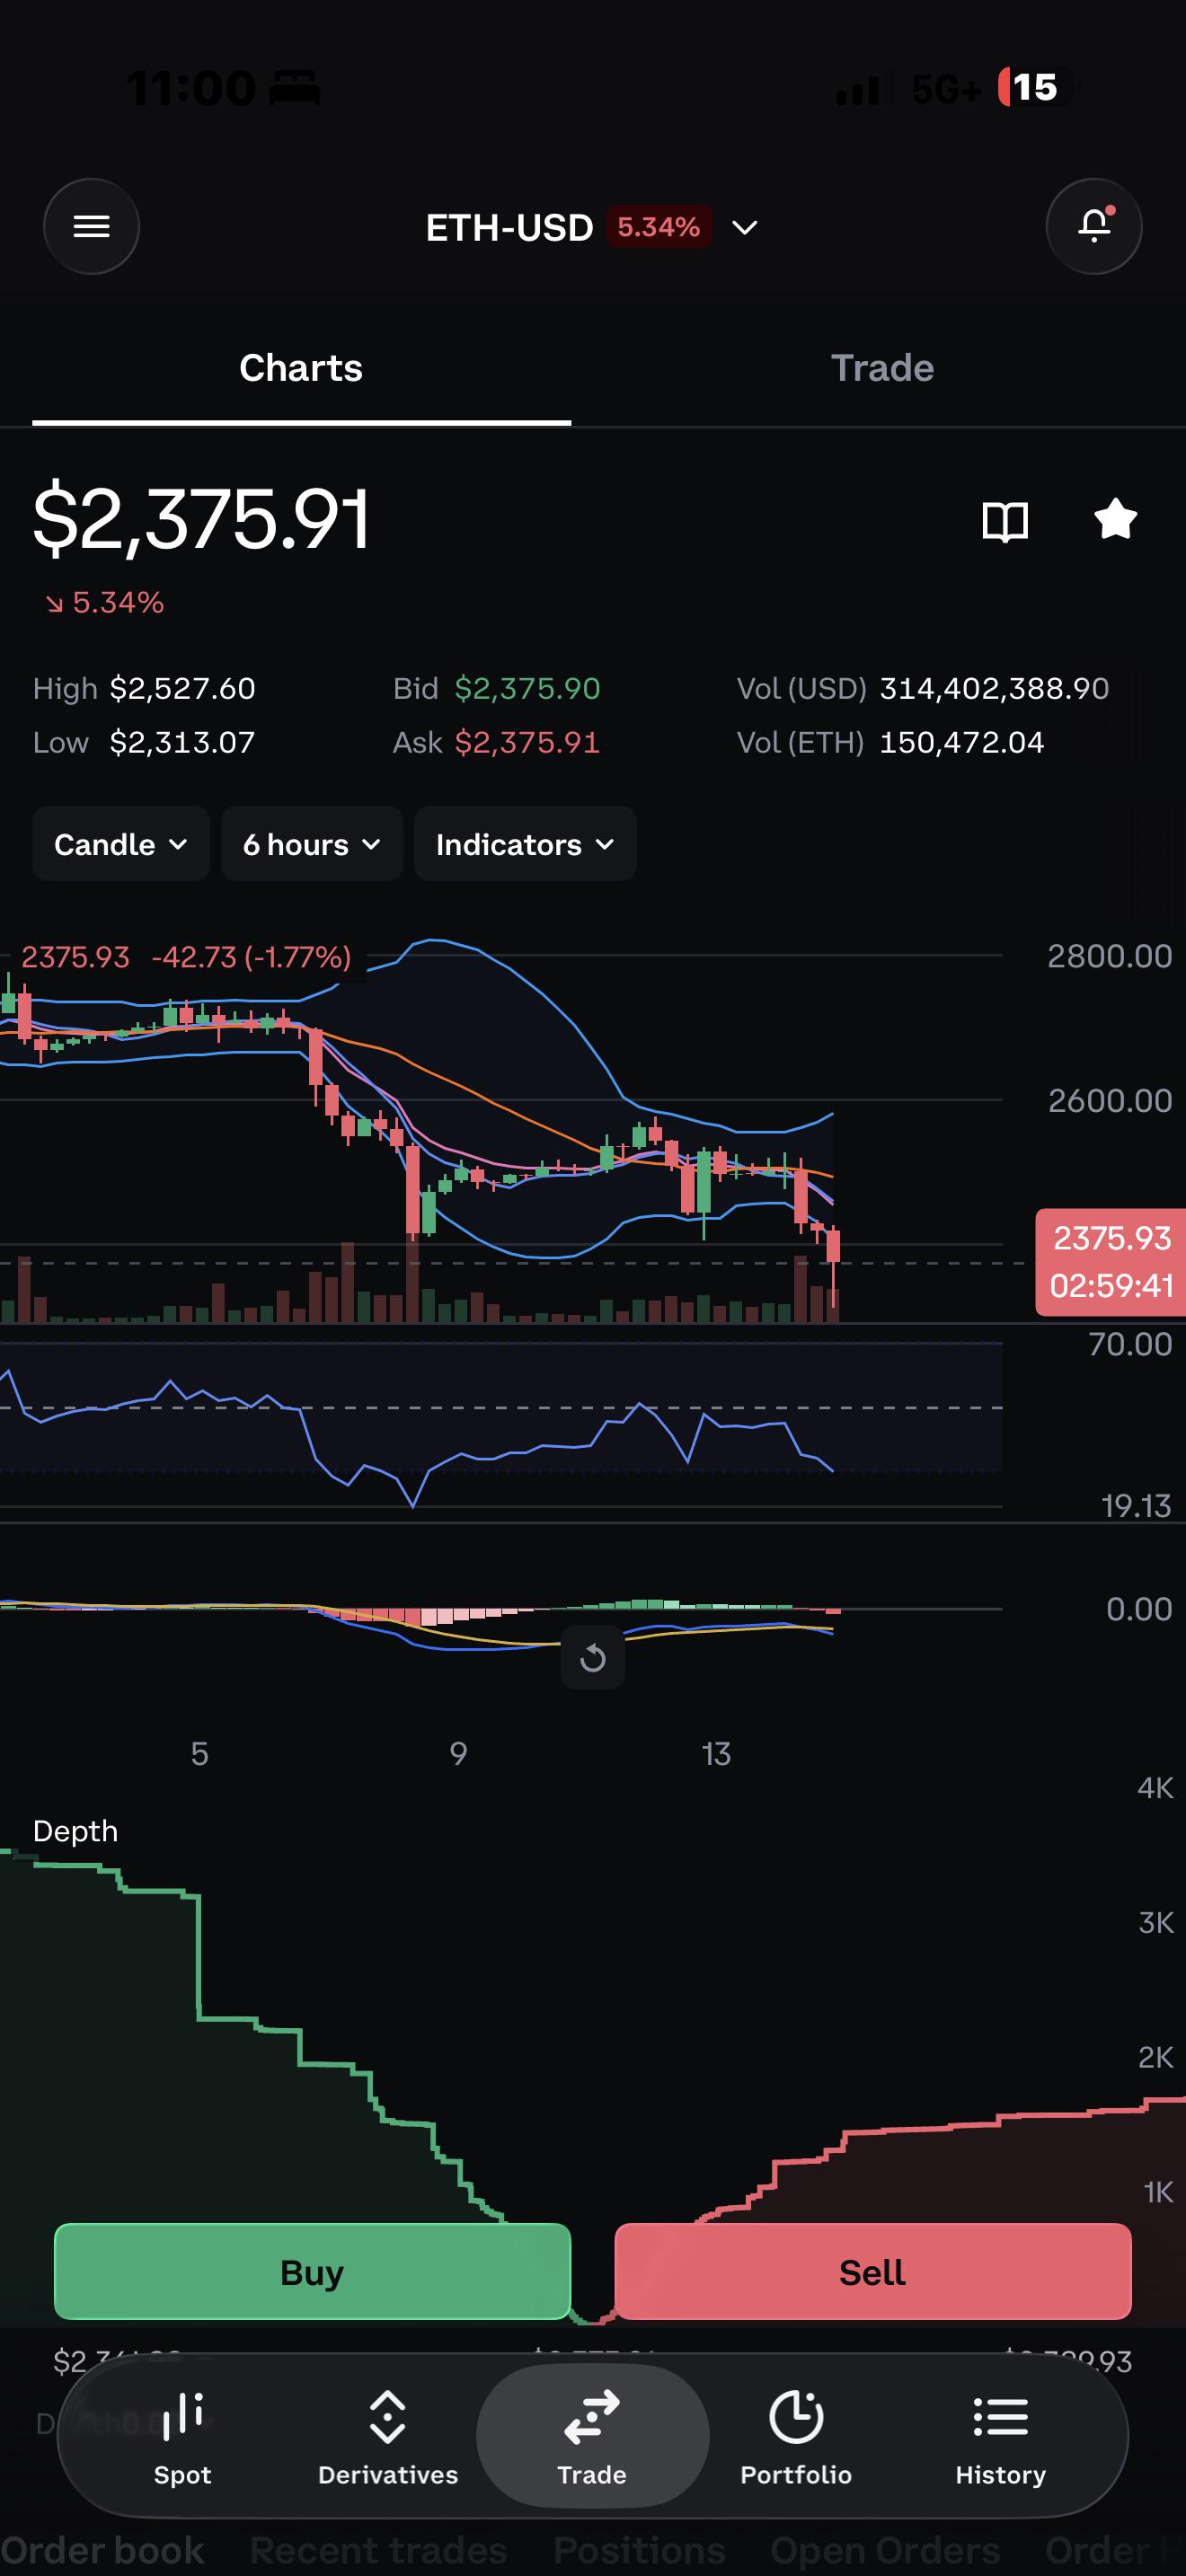
We have an official bullish divergence on the 6hr chart.

Yes—screenshot shows a developing bullish RSI divergence on ETH’s 6-hour chart.
Comparing the sharp low around October 8 with the latest selloff:
Price is making a lower low.
RSI is above its earlier low—visually, roughly 30 versus around 20 previously. Those are estimates from the image.
That’s the classic bullish divergence setup: price falls further while downward momentum is weaker. It can precede a bounce or reversal, but doesn’t establish a bottom by itself.
The catch is that the latest candle still has about three hours left, and RSI is still falling. The second trough needs to finish forming.
From this chart, I’d watch for:
RSI turning upward while holding above its October 8 low.
ETH reclaiming roughly $2,450–$2,500, the recent consolidation area, to strengthen the recovery case.
If RSI falls below its earlier trough as price makes new lows, this particular divergence disappears.
Your read is reasonable: a bullish setup is developing within a downtrend, with price confirmation still needed.

r/ethtrader • • Jun 06 '26

Analysis One POSITIVE in this crypto dump for ETH

67 Upvotes

This last week has been a bloodbath in crypto especially in ETH but out of the major longstanding cryptos in the top spots Ethereum is the only one which is still above its USD pair low in 2025. Also we are above the ETHBTC pair low in 2025.

BTC is below its 2025 drop.

Not saying the way ETH is losing on USD and BTC especially is not concerning and I am also not saying we wont break lower but for know that is atleast one thing that is positive for 2026 so far and also shows how bad 2025 was for ETH.

r/ethtrader • • Jul 26 '25

Analysis [ Removed by Reddit ]

242 Upvotes

[ Removed by Reddit on account of violating the content policy. ]

r/ethtrader • • Jun 16 '26

Analysis Ethereum: Why I Believe We’re in a Wyckoff Accumulation Phase

Thumbnail
gallery
65 Upvotes

Ethereum: Why I Believe We’re in a Wyckoff Accumulation Phase, See original Post 7 days ago.

I’ve been watching ETH closely because I’m heavily invested, and the more I study the chart, the more it resembles a textbook Wyckoff Accumulation structure.
For full transparency, I have real skin in the game: I currently hold just under 100 ETH with an average cost basis in the $1,700s. So I’m certainly biased toward the bullish side, but I’m trying to let the chart tell the story rather than my portfolio.

1. The Structure Looks Like Wyckoff Accumulation
On the daily chart:
Selling Climax (SC) around $1,742
Multiple Secondary Tests (STs)
Trading range develops
Spring below support at $1,505
Immediate recovery back into the range
The recent move to $1,505 looks exactly like a Wyckoff Spring: a breakdown below support designed to trigger stops, trap bears, and shake out weak hands before reversing higher.
The best Springs rarely feel bullish when they happen. They usually convince everyone the market is headed much lower.

2. We Already Reclaimed the Selling Climax Level
One detail I think many people are overlooking:
After the Spring at $1,505, ETH reclaimed the original Selling Climax level around $1,741.
Not only that, but we also pushed into the next major Fibonacci resistance zone near $1,850, reaching approximately $1,848 before pulling back.
This is important because if the market were truly weak, you’d expect rejection at the prior SC level.
Instead, price reclaimed it and immediately challenged higher resistance.
That behavior is much more consistent with a market transitioning from accumulation into an early markup phase.

3. Daily RSI Hit Historically Oversold Levels
ETH’s Daily RSI reached approximately 12 during the Spring.
That’s an extreme reading rarely seen in ETH’s history and comparable to major cycle lows.
Since then:
RSI has recovered sharply
Price has held above the Spring low
Momentum is improving despite widespread bearish sentiment
Historically, these conditions are often present near major bottoms.

4. Funding Rates Have Turned Negative
Another piece of evidence supporting the accumulation thesis is derivatives positioning.
ETH funding rates have flipped negative across many exchanges.
That means:
Shorts are paying longs.
This tells us traders are aggressively betting on lower prices despite ETH already having experienced a significant decline.
When funding turns negative after a large selloff, it often signals bearish overcrowding rather than the beginning of a new bearish trend.

5. Fibonacci Levels Support the Bull Case
Using the recent high-to-low range:
0.786: $1,713
0.618: $1,875
0.50: $1,988
0.382: $2,100
0.236: $2,240
ETH has already reclaimed the 0.786 retracement and successfully tested the area just below the 0.618 retracement.
If this truly is a Wyckoff Accumulation, these levels become logical upside checkpoints as the markup phase develops.

6. Bears Are Becoming the Fuel
Negative funding rates tell us traders are leaning bearish.
At the same time, liquidation heatmaps continue showing significant liquidity stacked above current price.
If ETH can reclaim:
$1,875
$2,000
$2,100
those short positions could become fuel for a sharp squeeze higher.
Markets tend to move toward liquidity, and right now a lot of that liquidity appears to be sitting above price.

What Confirms the Bull Thesis?
For me:
✅ Spring low at $1,505 remains intact
✅ Selling Climax at $1,741 has been reclaimed
✅ ETH challenged the next Fibonacci level near $1,850
✅ Break and hold above $1,875
✅ Reclaim $2,000-$2,100
✅ Sign of Strength (SOS) above the trading range

What Invalidates It?
Simple.
A decisive breakdown and acceptance below $1,505.
If the Spring fails, then the accumulation thesis is likely wrong.

Final Thoughts
Nobody knows the future, but the evidence is becoming difficult for me to ignore:
Wyckoff Accumulation structure
Spring at $1,505
Reclaim of the $1,741 Selling Climax
Test of the next Fibonacci level near $1,850
Historically oversold RSI
Negative funding rates
Large short-side liquidity overhead
The market still feels overwhelmingly bearish.
Ironically, that’s exactly what I’d expect to see if a major bottom has already formed.
I’m not claiming certainty. I’m simply sharing what I see on the chart while risking my own capital alongside the thesis.
Curious what others think. Is this a legitimate Wyckoff Accumulation and Spring, or am I forcing the pattern?

r/ethtrader • • 21d ago

Analysis ETH Setup Target Reached! 🎯

Post image
0 Upvotes

The downside scenario we mapped on the ETH/USD 4H chart has played out.

r/ethtrader • • Sep 02 '25

Analysis ETH finally breaks free after years of rejections.

232 Upvotes

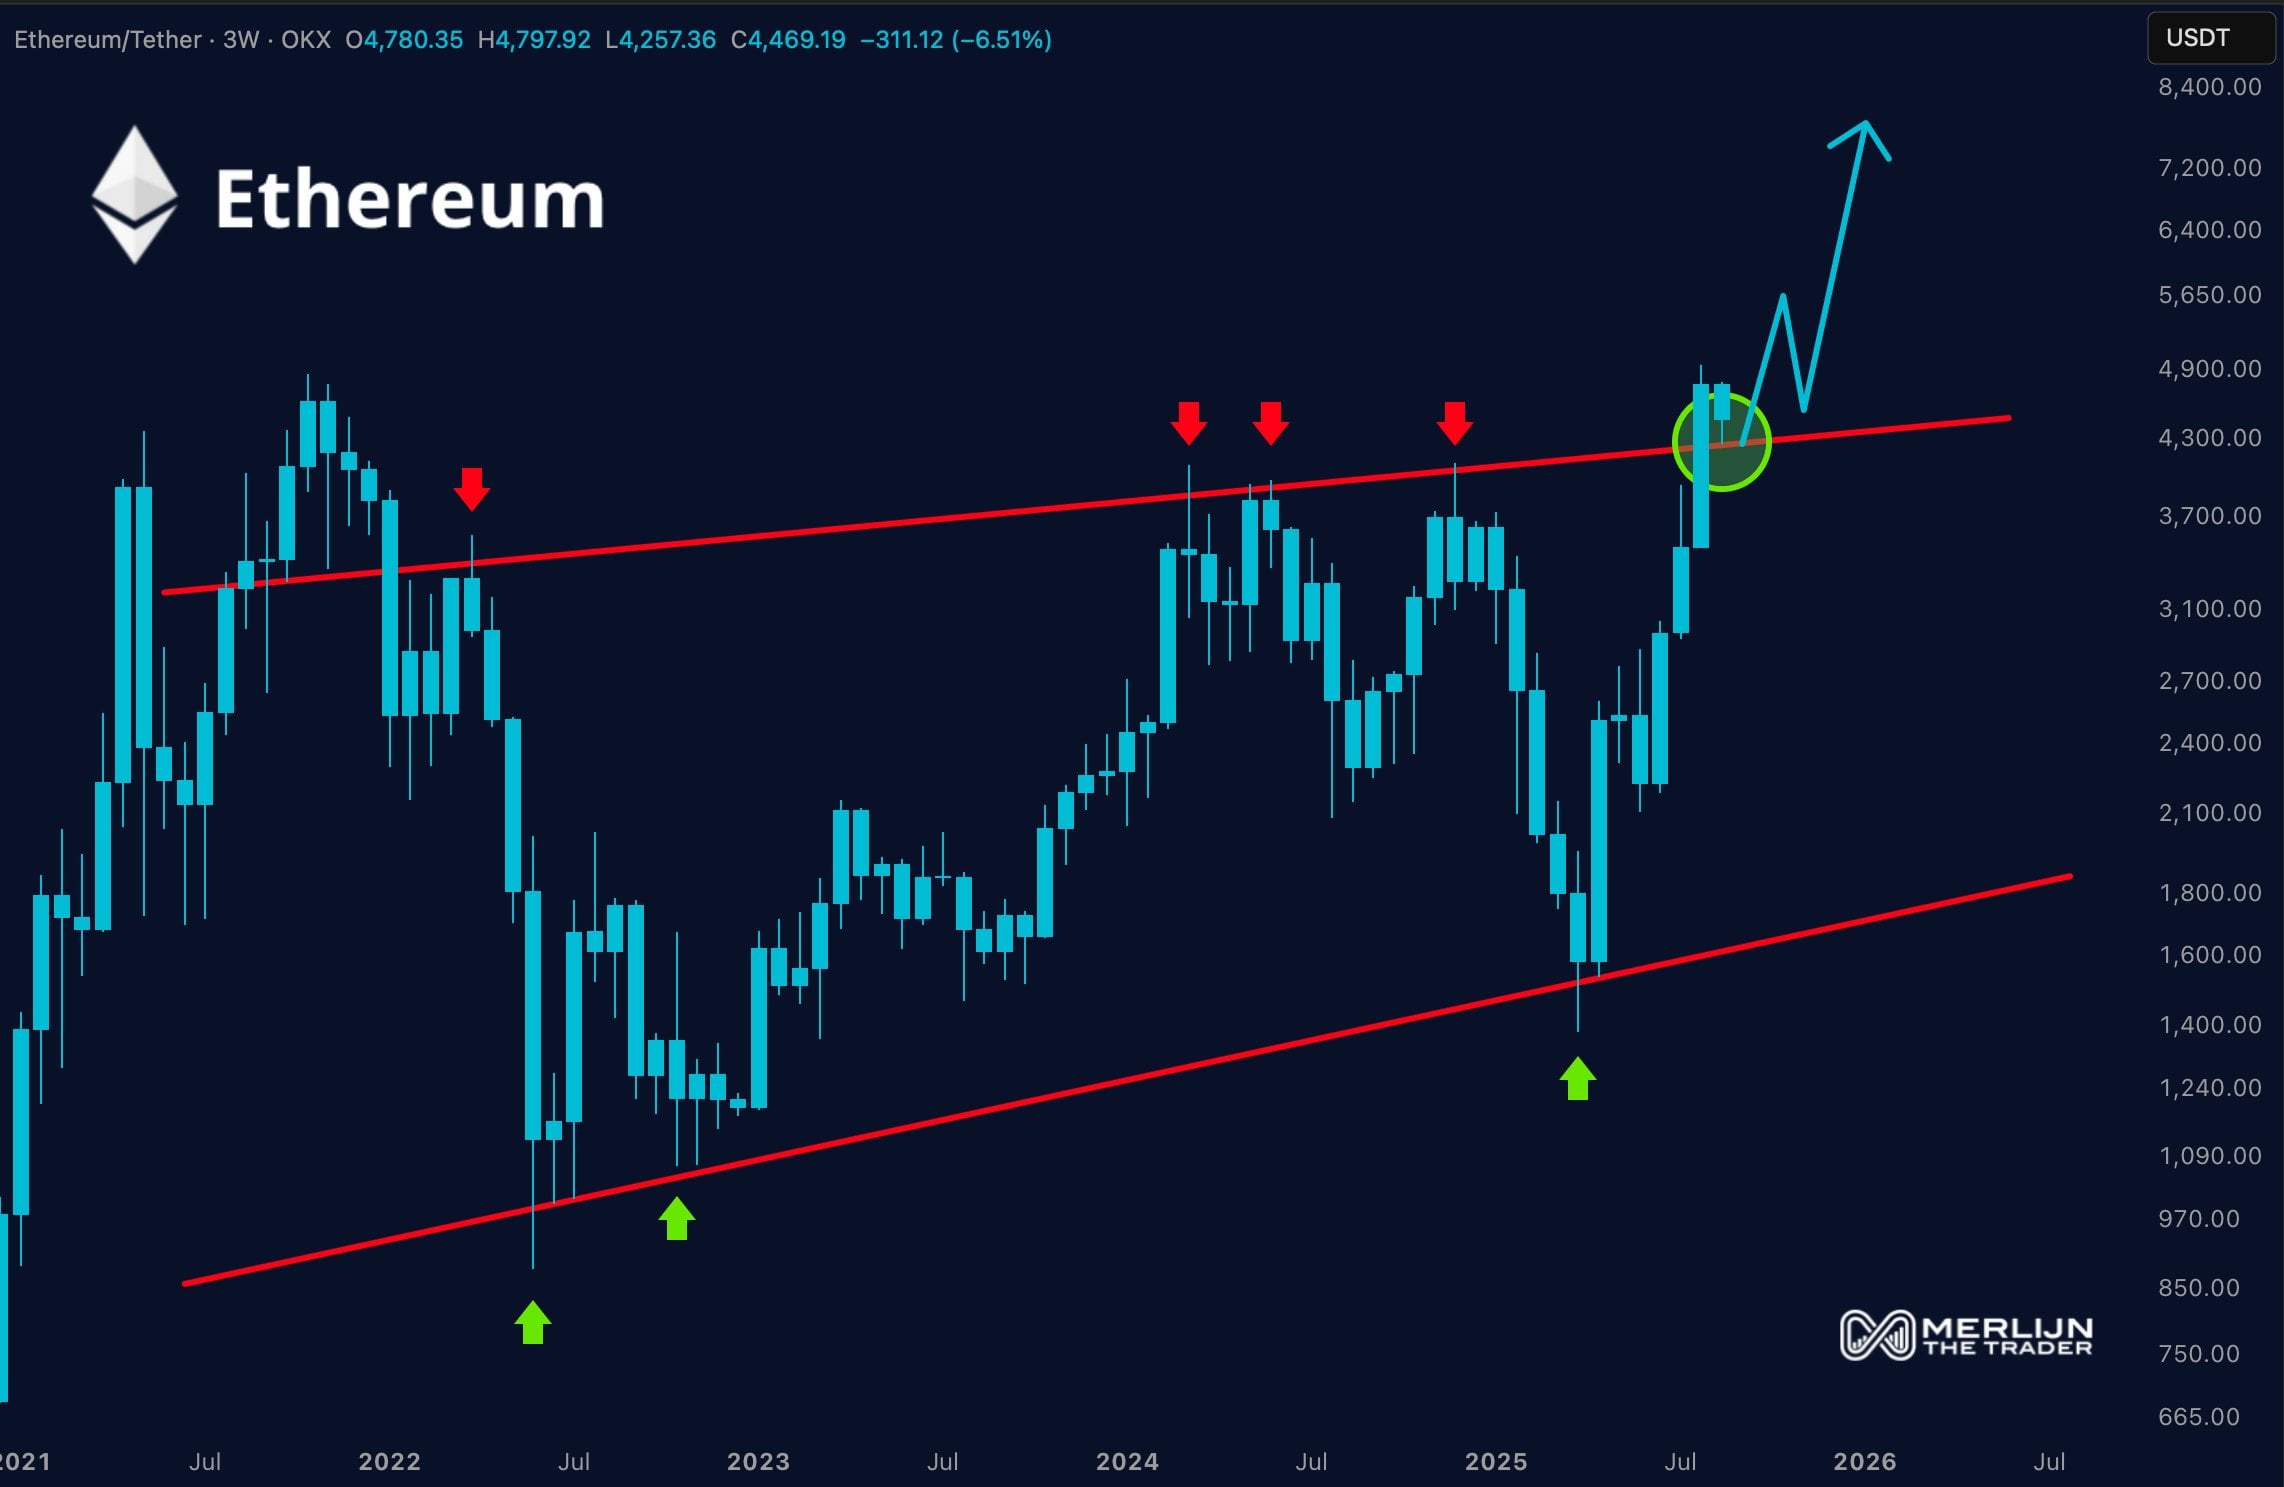
According to crypto investor and trader Merlijn, ETH just broke through a wall that has been holding it back for years!! Merlijn posted a chart on Twitter showing ETH finally pushing past the multi-year resistance line that rejected it again and again since 2021. Every attempt before ended the same way: price got dumped, market cooled off and people lost interest. But.. this time looks different.

Image from @MerlijnTrader on Twitter.

Looking at the chart above it shows that the old resistance is now acting as support. That is a huge flip!! In simple terms what used to be a ceiling turned into a floor and when that happens in crypto history says the next stage is expansion. In his tweet, Merlijn calls it 'the launchpad.' His target is $7k and beyond, it looks a little bold but if you look back at previous ETH cycles the pattern repeats each time: years of grinding, big rejections and then one breakout that sets the stage for the big rally.

Of course.. no one can predict the future with 100% certainty, but if you are following ETH do you really want to ignore this breakout? Whether it takes months or longer, the setup looks like ETH has finally cleared the path for a new supercycle. It is time for us to get ready for the expansion phase.

Source: https://x.com/MerlijnTrader/status/1962561089373401490

r/ethtrader • • May 03 '25

Analysis His bold move saved Ethereum.

193 Upvotes

Back in 2017 Vitalik Buterin, the big brain behind Ethereum, saw a disaster coming. Ethereum was his dream of a smarter blockchain, and it was in trouble. A thread on Twitter by StarPlatinum talks about this insane story, showing how Vitalik's decision to switch from Proof of Work to Proof of Stake saved crypto from a $100 billion collapse. I read the thread, and I will break it down.

Ethereum's PoW system was eating up too much energy, think 70 TWh a year by 2021. That is enough to power a small country by the way. There was a tremendous spike and Vitalik knew the network could not handle it. Another major problem was miners were getting too powerful. A pie chart in the original thread shows that just one pool, Dwarfpool, controlled 47.9% of the hashrate, creating centralization. Ethereum was supposed to be free, not a repeat of the old system.

Vitalik's fix was the Merge. In September 2022, Ethereum swapped its engine mid-flight, moving to PoS. Miners hated it and a lot of people still do. Miners would lose their gigs, but Vitalik pushed through. The Merge did a lot of great things, energy use dropped 99.95%, regular users gained more control and decentralization was saved. Despite the drama with developers and miners raging, Vitalik's bet paid off. Ethereum is still here, proving sometimes the hardest path is the right one.

Twitter thread: https://x.com/StarPlatinumSOL/status/1917561892396228992

r/ethtrader • • Aug 25 '26

Analysis Bull Flag Alert on Daily Chart

Post image
60 Upvotes

Look like we are starting to Bull Flag on the daily chart. Range is 2355-2540 on the Flag.
Upside Target: $400-500 pump from 2540. (2940-3040)

What do others think that are on long and short trades on ETH?